Tag Archives: function

Generating Alpha With A 2015 Model Portfolio

Summary 2015 will be a volatile year, and only the great stock pickers will come out significantly ahead. Don’t look for the needle in the haystack. Just buy the haystack! Taking the Jack Bogle approach might be the best way to mitigate risk and avoid unnecessary volatility. The first (and only) email request sent to SAFoundationalResearch@gmail.com was a request to create a model portfolio against the S&P 500. The weightings below are what we recommend for 2015: S&P 500 Recommendation Equity Sectors Weight Weight Difference Consumer Discretionary 12.0% 12.0% 0.0% Consumer Staples 9.9% 10.9% 1.0% Energy 8.3% 10.3% 2.0% Financials 16.5% 18.0% 1.5% Heathcare 14.5% 16.0% 1.5% Industrials 10.4% 8.9% -1.5% Information Technology 19.7% 19.7% 0.0% Materials 3.2% 3.2% 0.0% Telecom 2.3% 0.0% -2.3% Utilities 3.2% 1.0% -2.2% We fundamentally believe that 2015 will be a volatile year, and only the great stock pickers will come out significantly ahead. That being said, this portfolio will take the Jack Bogle approach and will strictly purchase SPDR ETFs. “Don’t look for the needle in the haystack. Just buy the haystack!” – Jack Bogle Some other rules for this $100,000 model portfolio: Opportunity to rebalance quarterly (but not required) Must be within +/-3% of the sector benchmark Must be at least 80% invested at all times Recommended $100,000 Model Portfolio Ticker Price as of Jan 2, 2015 Number of Shares Consumer Discretionary Select Sector SPDR ETF (NYSEARCA: XLY ) 72.15 166 Consumer Staples Select Sector SPDR ETF (NYSEARCA: XLP ) 48.49 224 Energy Select Sector SPDR ETF (NYSEARCA: XLE ) 79.16 130 Financial Select Sector SPDR ETF (NYSEARCA: XLF ) 24.73 727 Health Care Select Sector SPDR ETF (NYSEARCA: XLV ) 68.38 233 Industrial Select Sector SPDR ETF (NYSEARCA: XLI ) 56.58 157 Technology Select Sector SPDR ETF (NYSEARCA: XLK ) 41.35 476 Materials Select Sector SPDR ETF (NYSEARCA: XLB ) 48.58 65 Utilities Select Sector SPDR ETF (NYSEARCA: XLU ) 47.22 21 Cash 244.31 244.31 After this article, Foundational Research will post a series of articles for each sector and the respective industries. Below are some highlights on half of the sectors: Technology Sector Highlights We remain cautious on the technology sector, and recommend an equal weight. Although the sector, as measured by the XLK, has outperformed the broader market in 2015, much of that is due to AAPL, which accounts for more than 16% of the XLK index. We also believe the shift to cloud computing will have a negative impact on earnings for most large-cap technology companies, especially over the next few years, when the highest switching over/expenditure costs are expected. Valuations are also higher than they used to be, with overall tech trading at a 22% premium to the 5-year median P/E and a 70% premium to trough valuation, but the Technology sector still trades at a -9% discount to the S&P 500. Telecommunications Sector Highlights News flow continues to be almost exclusively negative in the telecommunications sector. Pricing is likely to continue to be a problem in wireless, and the wireline business is in secular decline. The negative pricing/promotion backdrop in wireless accelerated this past year. While the competitive condition may take a seasonal respite early this year following the holidays, the intermediate-term prospects in this regard is for more of the same, in our opinion. That is, more brutal competition. Energy Sector Highlights The downturn in crude oil prices and the prices for oil & natural gas-related stocks accelerated to the downside over the two quarters. Demand continued to suffer from weak economic conditions and/or slowing economic growth, particularly in the eurozone and China. At the same time, investors were spooked by ongoing strong oil production growth from US unconventional basins and the recovery of disrupted output from Libya. There was also the risk that the sanctions on Iran might be reduced or eliminated, potentially opening the way for increased production (approx. +500,000-700,000 barrels/d). Finally, OPEC was not able to come to an agreement to cut production to balance the market, leading to a sizeable drop in oil prices the day after Thanksgiving. We believe that the share prices have over-reacted to the crude oil price drop. Historically speaking, whenever energy stocks have lead decline for six months, they then lead for the following six months. “This time is different” often leads investors astray. Industrial Sector Highlights We are concerned that reductions to oil & gas capital spending budgets will have an outsized impact on the machinery and electrical equipment industries. There appears to be an expectation that better consumer spending trends following cheaper gasoline prices will spur further capital spending from the consumer discretionary sector. This may be the case, but we’d expect any pickup in capex from the discretionary sector to take time, while the cuts from the oil & gas complex will be more immediate. Additionally, sales into the oil & gas complex are among the most profitable for our companies, and will be difficult to replace (even if there is a pickup in consumer discretionary capex). Consumer Discretionary Highlights The market weight recommendation on the consumer discretionary sector reflects a more balanced view of the tailwinds and headwinds facing the group over this year. Fairly significant 2014 underperformance in the group has led to more reasonable relative valuations of late, and that, coupled with falling gas prices (a potential benefit to the consumer) and easing top line/margin comparisons in F15 have resulted in a more balanced risk/reward. That being said, many near-term macro data points remain mixed (i.e. jobs, housing, food commodity costs) and could keep a lid on overall earnings growth, which prevents a more constructive view on the group, for now. Material Sector Highlights Downstream is the new upstream. While we retain our neutral recommendation on the complex, we favor downstream/processed/refined-related commodity companies that benefit from the decline in upstream pricing. The perfect storm of increased production, stemming from higher prices, followed by slowing demand growth has resulted in a backdrop where many upstream commodities are in “oversupply.” The stronger United States dollar is only adding fuel to the fire. We would remain positioned in those commodities that benefit from falling inputs and oligopolic behavior. Our two preferred commodities are steel and aluminum, with the former capitalizing on falling iron ore prices, and the latter on falling power prices. We would avoid copper and iron ore where we have yet to see price support, as the cost curve continues to decline. Consumer Staples Highlights The third-quarter earnings results certainly did not encourage us to change our view. The operating environment remains challenging for packaged goods companies, especially so for food companies, yet the consumer staples sector continues to make new highs. Investors seem to continue to seek out yield, and probably even more so, stability, as we move toward year-end. Category growth remains sluggish in developing markets, and has slowed in emerging markets. The currency headwinds have intensified for many companies. Domestic attempts to drive volume with more promotions have not been as successful as in the past. The debate continues as to whether there has not been enough innovation or the consumer is still in a constrained in spending mode – we believe it has. Healthcare Highlights We continue to believe the Patient Protection and Affordable Care Act (ACA) will be a positive force in healthcare for the next 3-5 years, with some potential ramifications that need to be watched. As we approach year 2 of the expansion part of the law, Republicans have taken control of the Senate, and the Supreme Court has decided to review another case relating to the legislation. Scientific breakthroughs are creating a cornucopia of new biopharmaceuticals for unmet or poorly served medical needs. The demographics of the major industrialized nations, including North America, Europe, and Japan, are changing to larger populations of elderly patients, who are major consumers of drugs. Utilities Highlights We see nothing operationally wrong with the Utilities sector. The reach for yield has caused share prices to increase. Without a capex increase, and with prices as high as they are, we believe they will not appreciate any further. The last time the Utilities sector lead the market over the course of a year, as it did in 2014, it only returned 1% total return the next year. Over the next few weeks, we will go in-depth on each sector, so please remember to “Follow” us to not miss anything!
Large-Cap Portfolio Management System With S&P 500 Minimum Volatility Stocks

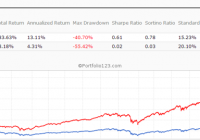
Originally published on Jan. 2, 2015 This R2G model trades in highly liquid large-cap stocks selected from those considered to be minimum volatility stocks of the S&P 500 Index. When adverse stock market conditions exist the model reduces the size of the stock holdings by 60% and buys the -1x leveraged ProShares Short S&P500 ETF (NYSEARCA: SH ). It produced a simulated survivorship bias free average annual return of about 36% from Jan-2000 to end of Dec-2014. Minimum volatility stocks should provide exposure to the stock market with potentially less risk, seeking to benefit from what is known as the low-volatility anomaly . Consequently, they should show reduced losses during declining markets, but should also show lower gains during rising markets. However, our backtests show that better returns than the broader market can be obtained under all market conditions by selecting 8 of the highest ranked stocks of a universe made up from minimum volatility stocks of the S&P 500. Minimum volatility stock universe of the S&P 500 By definition, minimum volatility stocks should exhibit lower drawdowns than the broader market and show reasonable returns over an extended period of time. It was found that a universe of stocks mainly from the Health Care, Consumer Staples and Utilities sectors satisfied those conditions. This minimum volatility universe of the S&P 500 currently holds 119 large-cap stocks (market cap ranging from $4- to $295-billion), and there were 111 stocks in the universe at the inception of the model, on Jan-2-2000. Performance of all the stocks in the universe from 2000 to 2014 The backtest period was 15 years, from January 2000 to December 2014. The backtest simulates holding all stocks of the universe equal weight and rebalancing every week to equal weight. Dividends are included in the stock price data, and are therefore accounted for in the backtest. The maximum drawdown during the backtest period would have been 40.7%, considerably less than the 55.4% for SPY , the SPDR S&P 500 ETF Trust. Annualized return (CAGR) of 13.1% was also considerably better than the 4.3% for SPY. (click to enlarge) (click to enlarge) Performance of all the stocks in the universe during up-market conditions The period March 2009 to December 2014 qualifies as an up-market period. The maximum drawdown would have been 14.9%, less than the 20.1% for SPY. The backtest shows an annualized return of 25.0%, marginally better than the 21.3% for SPY. (click to enlarge) (click to enlarge) The Best8(S&P500 Min-Volatility) model One can see from the above analysis that our S&P 500 minimum volatility stock universe provided better returns than what is expected from minimum volatility ETFs, showing less drawdown during declining markets, but also exhibiting gains during rising markets, similar to, or better than, the broader market. Therefore this universe provides the basis for periodically selecting the highest ranked 8 stocks according to a ranking system. Ranking System To find stocks which may be undervalued, all stocks of the S&P 500 point-in-time minimum volatility stock universe were ranked weekly according to the following parameters: Valuation (measured as market capitalization, debt and cash relative to earnings before interest, taxes, depreciation & amortization, future cash flow and projected earnings), Efficiency (measured as future cash flow relative to total assets), Financial Strength (measured as future cash flow relative to total debt), Short Interest (being the short interest ratio), Trend (measured as the stock price relative to a moving average of the price), with the highest rank obtainable being 100. To test the effectiveness of the ranking system, the universe was divided into 15 “buckets”, each holding about 8 stocks and performance was tested over 15 years. One can see that the “bucket” on the very right with the highest ranks also shows the highest annualized return of about 23%. (Note, there are no buy- and sell-rules in the ranking system.) Trading Rules The model assumes stocks to be bought and sold at the next day’s closing price after a signal is generated. Variable slippage accounting for brokerage fees and transaction slippage were taken into account. (See the Appendix for variable slippage.) Taxes are assumed to be deferred, as for retirement accounts. Buy Rules: Short Interest Ratio < 2.8, and exclude some of the largest market cap stocks from being selected. Sell Rules: Performance In the figures below the red graph represents the model and the blue graph shows the performance of benchmark SPY. Figures 1, 2 and 3 show performance comparisons: Figure 1: Performance 2000-2014 and hedging with SH. The model reduces the size of the stock holdings by 60% to buy SH during down-market conditions. (Note: The inception date of SH was June 19, 2006. Prior to this date values are “synthetic”, derived from the S&P 500.) Annualized Return= 36.3%, Max Drawdown= -24.0%. Figure 2: Performance 2000-2014 without hedging. Annualized Return= 25.6%, Max Drawdown= -51.7%. Figure 3: Performance 2009-2014 without hedging. Annualized Return= 42.6%, Max Drawdown= -17.3%. (click to enlarge) (click to enlarge) (click to enlarge) (click to enlarge) (click to enlarge) (click to enlarge) Figures 4 to 8 show performance details: Figure 4: Performance 2000-2014 versus SPY. Over the 15-year period $100 invested at inception would have grown to $10,368, which is 56-times what the same investment in SPY would have produced. Figure 5: 1-year returns. Except for 2006 the 1-year returns were always higher than for SPY. There was never a negative return over one calendar year. Figure 6: 1-year rolling returns. The minimum 1-year rolling return of the 3-day moving average was -3.1% early in 2009. Figure 7: Distribution of monthly returns. One can see that the monthly returns follow a normal distribution, displaced to the right relative to the returns of SPY. Figure 8: Risk measurements for 15-year and trailing 3-year periods. (click to enlarge) (click to enlarge) (click to enlarge) (click to enlarge) Liquidity To calculate the maximum dollar-value of a portfolio without incurring too much slippage the following formula was provided by P123: ($LiquidityBottom20Pct * #Position * 5%) / WeeklyTurnover% where 5% is the maximum amount traded without affecting the stock price. $LiquidityBottom20Pct = $ 16.8-million #Positions = 8 Annual Turnover% = 430% WeeklyTurnover% = 8.3% Maximum Portfolio Size = ($16.8 * 8 * 5%) / 8.3% = $80-million Thus, this model could accommodate a good number of individual investors. Variable Slippage The model assumes that stocks are bought/sold at the next day’s closing price after the signal is generated. Since one may not be able to obtain the closing price, a slippage factor is applied to account for a possible higher/lower price for the transactions. The slippage percentage is calculated for every transaction based on this algorithm: 1) The 10 day average of the daily traded $-amount is calculated (price*volume). 2) The slippage is set according to where the average falls in this table: 0 – $50K 5.00% $50K – $100K 1.50% $100K – $350K 0.75% $350K – $1M 0.50% $1M – $5M 0.25% $5M+ 0.10% 3) Add (1/ Price)% to the result from Step 2. For example, Step 3 would add 1% to the slippage if the stock trades at $1, 0.1% if it trades at $10, etc. For the following transaction Date Symbol Type Shares Trading Volume on day Price excluding slippage 5/28/2013 XXX BUY 64,108 3,338,776 50.27 the slippage percentage would be (0.10 + 1/50.27) = 0.120% of $50.27, amounting to about 6 cents per share. So the average price per share paid for this transaction is $50.33.

A Contrary Play For The Patient Investor In 2015

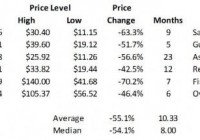
Summary For investors who are looking for inexpensively valued stocks that may be poised to benefit from mean reversion, energy stocks are now on the radar for a rebound in 2015. There are many factors that influence the outlook of energy stocks, but valuation and the price of oil are two places to start. Oil prices had a material decline in 2014. At the same time, energy stocks are showing inexpensive valuation based on their price-to-book-value ratio. By Nick Kalivas The recent plunge in oil prices has created a dramatic re-pricing of stocks in the energy sector. For investors who are looking for inexpensively valued stocks that may be poised to benefit from mean reversion (the theory that stocks move toward their average price over time), energy stocks are now on the radar for a rebound in 2015. Let’s take a look at historically large declines in the oil market and valuations in the energy sector to get some perspective. Examining historical price declines The energy sector is likely to find the most buying interest when the crude oil market is near a bottom, but picking a bottom in any market is never easy and may be a fool’s game. Over the past 10 years, the price of the S&P 500 Energy Sector has a 0.829 correlation to the price of West Texas Intermediate (NYSE: WTI ) crude oil. 1 Since the mid 1980s, there have been five times where the price of WTI has posted a decline of at least 40% from closing month high to closing month low. The table below compares those five historical periods with 2014’s price drop. (At the time of this writing, there were a few days left in December, so I used the Dec. 23 closing price of $56.52 to represent the month-end price.) Major Oil Market Declines Based on Monthly Closing Prices of WTI *Dec 23, 2014 price assumed as month-end close. Source: Bloomberg LP as of Dec. 23, 2014 Past performance is no guarantee of future results. The table indicates that the average and median durations for price declines are 10.3 and 8.0 months. If December 2014 were to mark a current low, the duration of the sell-off would be on the shorter side of history, at just six months. It seems like a bottom may be more likely in January or February 2015. The table highlights that the current decline of 46.4% (using the Dec. 23 close of $56.52) would be on the lower end of the distribution. The average and median declines are 55.2% and 54.1% respectively. The period most like the present (1985/1986, when the market was last awash in excess oil supply) saw a drop of 63.3%. The decline in 2008/2009 seems to be extreme as it was driven by a global economic and financial meltdown. Extrapolating based on historical examples is not without risk, but points 1 and 2 suggest that in 2015, we could see a close in the price of WTI in the $45 to $50 area in January or February, which could represent the bottom of the oil price plunge and lead to a cyclical recovery in energy shares. Examining energy sector valuations One way to examine the value of the energy sector is through the price-to-book-value ratio (P/B), which is affected not only by changes in companies’ stock price, but also by changes in the value of companies’ assets (book value). Monitoring this ratio over time helps to adjust for the impact of industry ups and downs. Oil properties and reserves are subject to impairment charges and changing values based on industry conditions – nonetheless, at some point the potential negatives are reflected in share prices. The P/B per share can shed light on when extremes are priced. Both the S&P 500 and the S&P SmallCap 600 Energy sectors appear to be approaching areas of perceived value based on their P/B ratios. At writing, the P/B of the S&P 500 Energy Sector was 1.78 and on the lower end of the range seen since 1990. The ratio had lifted from a low of 1.605 on Dec. 15, 2014. These P/B ratios compare to an average of 2.39 going back to 1990. 1 (The black dotted lines represent two standard deviations above and below the average price, which would be considered extreme pricing levels.) Source: Bloomberg LP as of Dec. 23, 2014. Past performance is no guarantee of future results. An investment cannot be made directly in an index. Valuation appears even more depressed looking at the S&P SmallCap 600 Energy sector where the price to book value ratio was 0.923. The ratio has lifted from a recent low of 0.78 on Dec. 15, 2014 and compares to an average of 2.02 going back to 1995. 1 Source: Bloomberg LP as of Dec. 23, 2014. Past performance is no guarantee of future results. An investment cannot be made directly in an index. Evaluating energy stocks There are many factors that influence the outlook of energy stocks, but valuation and the price of oil are two places to start. Oil prices had a material decline in 2014, although it is too early to say they have bottomed and history may argue for more weakness into the New Year. At the same time, energy stocks are showing inexpensive valuation based on their P/B ratio, and valuation suggests investors may want to put the energy sector on their shopping list for 2015. Investors seeking exposure to the energy sector may want to consider the PowerShares Dynamic Energy Exploration & Production Portfolio (NYSEARCA: PXE ) or the PowerShares DWA Energy Momentum Portfolio (NYSEARCA: PXI ).* PXE tracks an index that invests in exploration and production companies based on price momentum, earnings momentum, quality, management action, and value. PXI holds stocks that are displaying relative price strength. They are two smart beta solutions for investors looking for non-market-cap-weighted investment in the oil sector. Investors focused exclusively on the small-cap sector may want to consider the PowerShares S&P SmallCap Energy Portfolio (NASDAQ: PSCE ). 1 Source: Bloomberg LP as of Dec. 23, 2014 Important Information *Effective Feb. 19, 2014, changes to the fund’s name, investment objective, investment policy, investment strategies, index and index provider were made. Dorsey Wright & Associates, LLC replaced NYSE Arca, Inc. as the index provider for the fund, and the name of the index changed from Dynamic Energy Sector IntellidexSM Index to DWA Energy Technical Leaders Index. In addition, the name of the fund changed from PowerShares Dynamic Energy Sector Portfolio to PowerShares DWA Energy Momentum Portfolio. Important information The S&P 500 Energy Index is an unmanaged index considered representative of the energy market. The S&P SmallCap 600 Energy Index is a capitalization-weighted index that includes the energy sector companies within the S&P SmallCap 600 Index. Correlation indicates the degree to which two investments have historically moved in the same direction and magnitude. Price-to-book-value ratio (P/B ratio) is the ratio of a stock’s market price to a company’s net asset value. There are risks involved with investing in ETFs, including possible loss of money. Shares are not actively managed and are subject to risks similar to those of stocks, including those regarding short selling and margin maintenance requirements. Ordinary brokerage commissions apply. The fund’s return may not match the return of the underlying index. Investments focused in a particular industry or sector, such as the energy sector and the oil and gas services industries are subject to greater risk, and are more greatly impacted by market volatility, than more diversified investments. The momentum style of investing is subject to the risk that the securities may be more volatile than the market as a whole, or that the returns on securities that have previously exhibited price momentum are less than returns on other styles of investing. Investing in securities of small-capitalization companies may involve greater risk than is customarily associated with investing in large companies. Beta is a measure of risk representing how a security is expected to respond to general market movements. Smart Beta represents an alternative and selection index based methodology that seeks to outperform a benchmark or reduce portfolio risk, or both. Smart beta funds may underperform cap-weighted benchmarks and increase portfolio risk. The information provided is for educational purposes only and does not constitute a recommendation of the suitability of any investment strategy for a particular investor. Invesco does not provide tax advice. The tax information contained herein is general and is not exhaustive by nature. Federal and state tax laws are complex and constantly changing. Investors should always consult their own legal or tax professional for information concerning their individual situation. The opinions expressed are those of the authors, are based on current market conditions and are subject to change without notice. These opinions may differ from those of other Invesco investment professionals. NOT FDIC INSURED MAY LOSE VALUE NO BANK GUARANTEE All data provided by Invesco unless otherwise noted. Invesco Distributors, Inc. is the US distributor for Invesco Ltd.’s retail products and collective trust funds. Invesco Advisers, Inc. and other affiliated investment advisers mentioned provide investment advisory services and do not sell securities. Invesco Unit Investment Trusts are distributed by the sponsor, Invesco Capital Markets, Inc., and broker-dealers including Invesco Distributors, Inc. PowerShares® is a registered trademark of Invesco PowerShares Capital Management LLC (Invesco PowerShares). Each entity is an indirect, wholly owned subsidiary of Invesco Ltd. ©2014 Invesco Ltd. All rights reserved. blog.invesco.us.com