Tag Archives: nysearcaxlb

Valuation Dashboard By Industries: Energy And Materials, October 2015

Summary 4 key fundamental factors are reported across industries in Energy and Basic Materials. They can be used to assess the valuation status of an industry relative to its historical average. They can also be used as a reference for picking quality stocks at a reasonable value. I started in September 2015 a monthly series of articles giving a valuation dashboard by sector of companies in the S&P 500 index (NYSEARCA: SPY ). The idea is to follow up a certain number of fundamental factors for every sector, to compare them to historical averages. This article is the first one of another series going down at industry level in the GICS classification. It covers Energy and Basic Materials. The choice of the fundamental ratios used in this study has been justified here and here . You can find in this article numbers that may be useful in a top-down approach. There is no due diligence, analysis, recommendations, or lists of individual stocks to consider. To make a complete picture by sticking a “bottom-up” under the “top-down”, you have to navigate in articles written by industry experts. Here is the link to articles tagged by sector. Methodology Four industry factors calculated by portfolio123 are extracted from the database: Price/Earnings “P/E”, Price to sales “P/S”, Price to free cash flow “P/FCF”, Return on Equity “ROE”. They are compared with their own historical averages “Avg”. The difference is measured in percentage and named with a prefix “D-” before the factor’s name (for example “D-P/E” for the price/earnings ratio). The methodology is quite different from the S&P 500 dashboard. In some industries, S&P 500 companies are very few, so mid- and small caps are included here. Also, the fundamental industry factors are not median values, but proprietary data by the platform. The calculation aims at eliminating extreme values and size biases, which is necessary when going out of a large cap universe. The drawback is that these factors are not representative of capital-weighted indices. They may be very useful as a reference values for picking stocks in an industry, but are less relevant for ETF investors. Industry valuation table on 10/26/2015 The next table reports the 4 industry factors. For each factor, the next “Avg” column gives its average between January 1999 and October 2015, taken as an arbitrary reference of fair valuation. The next “D-xxx” column is the difference between the historical average and the current value, in percentage. So there are 3 columns relative to P/E, and also 3 for each ratio.   P/E Avg D- P/E P/S Avg D- P/S P/FCF Avg D- P/FCF ROE Avg D-ROE Energy Equip. & Services 17.2 24.2 28.93% 0.81 1.73 53.18% 10.58 35.34 70.06% -6.2 7.34 -184.47% Oil/Gas/Fuel 19.65 18.53 -6.04% 2.06 3.35 38.51% 20.11 29.03 30.73% -6.59 4.47 -247.43% Chemicals 19.61 18.48 -6.11% 1.46 1.21 -20.66% 34.93 25.37 -37.68% 8.68 6.74 28.78% Constr. Materials 34.81 21.44 -62.36% 1.33 1.16 -14.66% 65.74 40.5 -62.32% 12.38 5.77 114.56% Packaging 20.11 17.96 -11.97% 0.91 0.61 -49.18% 21.67 20.09 -7.86% 18.77 8.34 125.06% Metals&Mining 21.49 19.83 -8.37% 1.55 2.65 41.51% 16.77 25.53 34.31% -19.32 -8.6 -124.65% Paper&Wood 26.08 21.27 -22.61% 0.75 0.72 -4.17% 20.16 22.81 11.62% 9.09 4.99 82.16% Valuation The following charts give an idea of the current status of Energy and Materials industries relative to their historical average. In all cases, the higher the better. Price/Earnings: Price/Sales: Price/Free Cash Flow: Quality Relative Momentum The next chart compares the price action of the SPDR Select Sector ETF in Materials (NYSEARCA: XLB ) and Energy (NYSEARCA: XLE ) with SPY. (click to enlarge) Conclusion Both sectors are in a downtrend, in absolute and relative to the broad market. At the industry level, Energy Equipment & Services, Oil/Fuel/Gas and Metals/Mining look undervalued relative to their own historical averages for several factors, but they are in negative territory for quality. At the opposite, Chemicals, Construction Materials and Packaging are above their historical average in quality, but overpriced for the 3 valuation factors. No industry in these two sectors looks very attractive. However, comparing individual fundamental factors to the industry factors provided in the table may help find quality stocks at a reasonable price. A list of stocks in energy and basic materials beating their industry factors is provided on this page . If you want to stay informed of my updates on this topic and other articles, click the “Follow” tab at the top of this article. You can choose the “real-time” option if you want to be instantly notified.
How To Find The Best Sector ETFs: Q3’15

Summary The large number of ETFs hurts investors more than it helps as too many options become paralyzing. Performance of an ETFs holdings are equal to the performance of an ETF. Our coverage of ETFs leverages the diligence we do on each stock by rating ETFs based on the aggregated ratings of their holdings. Finding the best ETFs is an increasingly difficult task in a world with so many to choose from. How can you pick with so many choices available? Don’t Trust ETF Labels There are at least 44 different Financials ETFs and at least 192 ETFs across all sectors. Do investors need 19+ choices on average per sector? How different can the ETFs be? Those 44 Financials ETFs are very different. With anywhere from 22 to 523 holdings, many of these Financials ETFs have drastically different portfolios, creating drastically different investment implications. The same is true for the ETFs in any other sector, as each offers a very different mix of good and bad stocks. Consumer Staples ranks first for stock selection. Energy ranks last. Details on the Best & Worst ETFs in each sector are here . A Recipe for Paralysis By Analysis We firmly believe ETFs for a given sector should not all be that different. We think the large number of Financials (or any other) sector ETFs hurts investors more than it helps because too many options can be paralyzing. It is simply not possible for the majority of investors to properly assess the quality of so many ETFs. Analyzing ETFs, done with the proper diligence, is far more difficult than analyzing stocks because it means analyzing all the stocks within each ETF. As stated above, that can be as many as 523 stocks, and sometimes even more, for one ETF. Any investor worth his salt recognizes that analyzing the holdings of an ETF is critical to finding the best ETF. Figure 1 shows our top rated ETF for each sector. Figure 1: The Best ETF in Each Sector (click to enlarge) Sources: New Constructs, LLC and company filings How to Avoid “The Danger Within” Why do you need to know the holdings of ETFs before you buy? You need to be sure you do not buy an ETF that might blow up. Buying an ETF without analyzing its holdings is like buying a stock without analyzing its business and finances. No matter how cheap, if it holds bad stocks, the ETF’s performance will be bad. Don’t just take my word for it, see what Barron’s says on this matter. PERFORMANCE OF ETF’s HOLDINGS = PERFORMANCE OF ETF If Only Investors Could Find Funds Rated by Their Holdings The PowerShares KBW Property & Casualty Insurance Portfolio ETF (NYSEARCA: KBWP ) is the top-rated Financials ETF and the overall best ETF of the 192 sector ETFs that we cover. The worst ETF in Figure 1 is the State Street SPDR Materials Select Sector Fund ETF (NYSEARCA: XLB ), which gets a Neutral rating. One would think ETF providers could do better for this sector. Disclosure: David Trainer and Max Lee receive no compensation to write about any specific stock, sector, or theme. Disclosure: I/we have no positions in any stocks mentioned, and no plans to initiate any positions within the next 72 hours. (More…) I wrote this article myself, and it expresses my own opinions. I am not receiving compensation for it. I have no business relationship with any company whose stock is mentioned in this article.

An Analysis Of 5 Materials ETFs

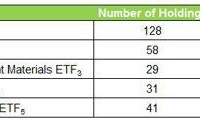
Summary These ETFs allow investors to obtain exposure to companies that provide a variety of inputs and raw materials essential to global economic function. As a whole, materials ETFs are more volatile and yield less than the S&P 500, but exceptions can be found. These funds offer varying risk and composition profiles that can be appropriate for a wide range of investors. Profiling the contenders (unless otherwise stated, market prices, NAV and SEC yield as of 1/29/15) : Vanguard Materials ETF (NYSEARCA: VAW ) This ETF seeks to track the performance of a benchmark index that measures the investment return of stocks in the materials sector and includes stocks of companies that extract or process raw materials. Market price: $104.73 30-day SEC Yield: 1.88% Number of holdings at 12/31/14: 128 iShares U.S. Basic Materials ETF (NYSEARCA: IYM ) This ETF seeks to track the investment results of an index composed of U.S. equities in the basic materials sector. It offers exposure to U.S. companies involved with the production of raw materials including metals, chemicals, and forestry products. Market price: $79.97 30-day SEC Yield: 1.67% Number of holdings at 01/28/15: 58 Guggenheim S&P 500 Equal Weight Materials ETF (NYSEARCA: RTM ) This ETF seeks to replicate as closely as possible, before fees and expenses, the performance of the S&P 500 Equal Weight Index Materials. Market price: $83.16 30-day SEC Yield: 1.45% Number of holdings at 01/29/15: 29 Materials Select Sector SPDR ETF (NYSEARCA: XLB ) This ETF seeks to provide investment results that, before fees and expenses, correspond generally to the price and yield performance of the S&P Materials Select Sector Index. Market price $47.88 30-day SEC Yield: 2.00% Number of holdings at 01/28/15: 31 Powershares DW A Basic Materials Momentum ETF (NYSEARCA: PYZ ) This ETF seeks to provide investment results that, before fees and expenses, correspond generally to the price and yield performance of the S&P Materials Select Sector Index. Market price $51.56 30-day SEC Yield: 1.06% Number of holdings at 01/28/15: 41 1) Diversification Diversification is the process of reducing non-systematic risk by investing in a variety of assets or asset classes that (hopefully) do not move up or down in value at the same time or magnitude. For the purposes of analyzing materials ETFs, I will look at both the number of holdings and also the industry diversification of constituents. a) Number of holdings An ETF does not need to hold every company of every sector that comprises its benchmark index, but 2 – 3 companies per industry is my subjective minimum to achieve adequate diversification. The basic materials sector can be broken up into roughly 20 industries including: agricultural chemicals, aluminum, chemicals – major diversified, copper, gold, independent oil & gas, industrial metals & minerals, major integrated oil & gas, nonmetallic mineral mining, oil & gas drilling & exploration, oil & gas equipment/services, oil & gas pipelines, oil & gas refining & marketing, silver, specialty chemicals, steel & iron, and synthetics. (click to enlarge) Winner: Vanguard. While some sub-sectors in the basic materials universe move in tandem, (think Oil and Gas drilling and Oil and gas marketing/refining both benefit from higher oil prices), other industries do not. Vanguard’s 128 holdings double its next closest competitor giving it the best shot at reducing non-systematic risk to an acceptably low level. b) Industry concentration Vanguard Materials ETF Courtesy of Vanguard iShares U.S. Basic Materials ETF Courtesy of BlackRock Guggenheim S&P 500 Equal Weight Materials ETF (click to enlarge) Courtesy of Guggenheim Investments Materials Select Sector SPDR ETF Courtesy of State Street Powershares DW A Basic Materials Momentum ETF Courtesy of Invesco Winner: Guggenheim. While Vanguard appears to be the most diversified with no component making up more than 25%, a closer look at captions reveals it is nearly 60% chemicals (just broken into various subcategories). Guggenheim is more balanced with three industries making up 10% or more of total weighting and while it is still heavy on chemicals, its overall chemical concentration is the lowest. 2) Expense ratio Expense ratio is the total of a funds operating expenses, expressed as percentage of average net assets. These expenses include management fees, Distribution/service or “12b-1” fees, custodial, legal, accounting, etc. Lower expense ratios, either through larger ETF size or smaller nominal expenses means higher investment returns. (click to enlarge) Winner: Vanguard, and everyone else. According to Morningstar , the average expense ratio for similar funds was 1.47%. Keeping fees and transaction costs as low as possible is something investors should always keep on the forefront of their mind. 3) Total return (click to enlarge) Winner: Powershares. I am always mentally benchmarking indexes and companies based on how they fared through and since the financial crisis. To look at that, you need to include several years before 2008. Powershares Basic Materials ETF was established in 2006, and its 3, 5 and (almost) 10 year returns (including the 2008 ordeal) are essentially on track with the S&P. That is saying something for a relatively narrowly focused ETF. 4) Valuation multiples (click to enlarge) Winner: SPDR. The SPDR ETF is trading at a discount to the S&P 500 (19.71) on a price to earnings basis. Honorable mention, iShares and Powershares whose earnings are also cheaper than those of the S&P 500. 5) Liquidity The ability to get out of a great investment is just as important as the ability to get in. While ETFs are generally regarded as having higher liquidity than mutual funds (primarily because they can be traded throughout the day, rather than just at the end), there are reasons to avoid ETFs with excessively low volume. Chief among these are higher bid-ask spreads, which may result in the inability to profitably execute a short-term trade (not a real issue for long-term investors). However, one of the issues that arises from low liquidity (a deviation between price and NAV) can actually be an opportunity. If an ETF is trading slightly below its NAV, but the market is not active enough for it to quickly resume equilibrium, you can shave a few points off your basis by looking for opportune entry points. (click to enlarge) Winner: SPDR. Higher volume means tighter bid-ask spreads, full stop. 6) Yield (click to enlarge) Winner: SPDR. SPDR is the only ETF that has a 30 day SEC yield greater than the S&P 500. The 30-day SEC yield is an annualized yield formula mandated by the Securities and Exchange Commission that is based on projected dividend yield of the fund’s holdings over a trailing 30 day period. 7) Volatility (click to enlarge) Winner: SPDR. This ETF exhibited lower volatility than all of its competitors over a three-year time frame and all but Guggenhem over five years. 8) Dividend history and growth (click to enlarge) Winner: Guggenheim. While it had a big drop off in distributions from 2010 – 2011, it has increased total distributions every year since then. Note for consideration, all of these funds pay quarterly distributions except for Vanguard, which pays annually. So, which Materials ETF should you own? SPDR! The Materials Select Sector ETF by SPDR is: the most active (liquid), the least volatile, offers the highest yield, the second lowest expense ratio, and trades at the lowest multiple of earnings. A word of caution Materials ETFs lagged the market as a whole in 2014. While last year’s losers can become this year’s winners, that is not always the case. A strong dollar can hurt the materials sector as it makes purchases of materials sector goods by foreign companies more expensive. Do your homework, review the composition and risk profile of each of these ETFs and monitor your holdings. Disclosure: The author has no positions in any stocks mentioned, and no plans to initiate any positions within the next 72 hours. (More…) The author wrote this article themselves, and it expresses their own opinions. The author is not receiving compensation for it (other than from Seeking Alpha). The author has no business relationship with any company whose stock is mentioned in this article.