Tag Archives: function

DGRS Looks Like Great Diversification At First, But Poor Liquidity Is More Likely
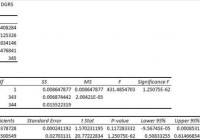
Summary I’m taking a look at DGRS as a candidate for inclusion in my ETF portfolio. The ETF tracks small dividend paying stocks, but the yield isn’t too great. The correlation to SPY is low, but the statistics are unreliable because of poor liquidity. Diversification within the portfolio isn’t bad, but it isn’t amazing either. I’m not assessing any tax impacts. Investors should check their own situation for tax exposure. Investors should be seeking to improve their risk adjusted returns. I’m a big fan of using ETFs to achieve the risk adjusted returns relative to the portfolios that a normal investor can generate for themselves after trading costs. I’m working on building a new portfolio and I’m going to be analyzing several of the ETFs that I am considering for my personal portfolio. One of the funds that I’m considering is the WisdomTree U.S. SmallCap Dividend Growth Fund (NASDAQ: DGRS ). I’ll be performing a substantial portion of my analysis along the lines of modern portfolio theory, so my goal is to find ways to minimize costs while achieving diversification to reduce my risk level. What does DGRS do? DGRS attempts to track the total return (before fees and expenses) of the WisdomTree U.S. SmallCap Dividend Growth Index. At least 90% of the assets are invested in funds included in this index. DGRS falls under the category of “Small Blend”. Does DGRS provide diversification benefits to a portfolio? Each investor may hold a different portfolio, but I use (NYSEARCA: SPY ) as the basis for my analysis. I believe SPY, or another large cap U.S. fund with similar properties, represents the reasonable first step for many investors designing an ETF portfolio. Therefore, I start my diversification analysis by seeing how it works with SPY. I start with an ANOVA table: (click to enlarge) The correlation is excellent at 74.6%. I want to see low correlations on my investments. Extremely low levels of correlation are wonderful for establishing a more stable portfolio. I consider anything under 50% to be extremely low. However, for equity securities an extremely low correlation is frequently only found when there are substantial issues with trading volumes that may distort the statistics. Standard deviation of daily returns (dividend adjusted, measured since August 2013) The standard deviation is great. For DGRS it is .8929%. For SPY, it is 0.6717% for the same period. SPY usually beats other ETFs in this regard. However, many ETFs won’t lose this badly to SPY, but it is worth noting that the standard deviation is pretty high. The best way to counteract the high standard deviation for an ETF with low correlation is to simply use it as a fairly small part of the portfolio. Liquidity is awful Average trading volume is absolutely terrible. The average volume for the last 10 days is only 3,181 shares. It’s possible to buy and sell in an ETF with terrible liquidity, but it is a very unattractive feature for the casual investor seeking diversification. I checked the change in closing values looking for the 0.00% change in dividend adjusted close that could indicate a day in which 0 shares changed hands. In the time period I used, from August 2013 through the middle of December 2014, there were 11 days where there was no change. It is possible that this is simply a coincidence, but investors should be aware that the presence of these days represents a challenge to the validity of the correlation and standard deviation that were calculated. The real values may be lower or higher, though I think higher is more likely than lower. Mixing it with SPY I also run comparisons on the standard deviation of daily returns for the portfolio assuming that the portfolio is combined with the S&P 500. For research, I assume daily rebalancing because it dramatically simplifies the math. With a 50/50 weighting in a portfolio holding only SPY and DGRS, the standard deviation of daily returns across the entire portfolio is 0.7321%. With 80% in SPY and 20% in DGRS, the standard deviation of the portfolio would have been .6811%. If an investor wanted to use DGRS as a supplement to their portfolio, the standard deviation across the portfolio with 95% in SPY and 5% in DGRS would have been .6721%. Why I use standard deviation of daily returns I don’t believe historical returns have predictive power for future returns, but I do believe historical values for standard deviations of returns relative to other ETFs have some predictive power on future risks and correlations. Yield & Taxes The distribution yield is 1.85%. This is a little low for retirees hoping to use the yield for income, but I’d be even more concerned about the poor liquidity if the investor had any liquidity needs. I wouldn’t consider an illiquid investment with only a moderate distribution yield if I were a retiring investor. I’m not a CPA or CFP, so I’m not assessing any tax impacts. Expense Ratio The ETF is posting .38% for both the gross and net expense ratios. I want diversification, I want stability, and I don’t want to pay for them. The expense ratio on this fund is higher than I want to pay for equity securities, but not high enough to make me eliminate it from consideration. I view expense ratios as a very important part of the long term return picture because I want to hold the ETF for a time period measured in decades. Market to NAV The ETF is at a .09% premium to NAV currently. Premiums or discounts to NAV can change very quickly so investors should check prior to putting in an order. The premium isn’t enough to be concerned about, but the liquidity issues could still result in a large bid-ask spread. If an investor was determined to invest in DGRS, I would hope they would use limit orders and be wary of crossing the spread. Largest Holdings The diversification within the ETF isn’t too bad. Unfortunately, it isn’t too good either. The top ten positions are all in the 2% to 1% range. (click to enlarge) Conclusion I’m currently screening a large volume of ETFs for my own portfolio. The portfolio I’m building is through Schwab, so I’m able to trade DGRS with no commissions. I have a strong preference for researching ETFs that are free to trade in my account, so most of my research will be on ETFs that fall under the “ETF OneSource” program. While I like the low correlation, I’m concerned that if liquidity were higher the correlation would also be higher. If the ETF had a substantial increase in volume without a significant increase in correlation, I’d be contemplating it. As it stands currently, I don’t see enough value to make it worth the headache of the low liquidity. I’ll be knocking it off my list of ETFs to consider for my long term portfolio. Additional disclosure: Information in this article represents the opinion of the analyst. All statements are represented as opinions, rather than facts, and should not be construed as advice to buy or sell a security. Ratings of “outperform” and “underperform” reflect the analyst’s estimation of a divergence between the market value for a security and the price that would be appropriate given the potential for risks and returns relative to other securities. The analyst does not know your particular objectives for returns or constraints upon investing. All investors are encouraged to do their own research before making any investment decision. Information is regularly obtained from Yahoo Finance, Google Finance, and SEC Database. If Yahoo, Google, or the SEC database contained faulty or old information it could be incorporated into my analysis. The analyst holds a diversified portfolio including mutual funds or index funds which may include a small long exposure to the stock.
Proof Positive That U.S. Stock ETFs Are Not The Only Place To Be

Financial professionals are blaming the latest round of risk asset uncertainty on a variety of factors, from the continuing sell-off in oil to the possibility of Greece being kicked out of the euro-zone. Still others are pointing to anxiety over the U.S. Federal Reserve’s intention to raise its overnight lending rate target in mid-2015 – the first move of its kind since December of 2008. Meanwhile, the biggest names in bonds have added fuel to the fire. Bill Gross at Janus has declared that the good times are over; he anticipates a plethora of “minus signs” in front of riskier asset classes by year-end. Similarly, Jeff Gundlach of DoubleLine believes the U.S. 10-year yield will test 1.38% from its 2.0% level. That is in sharp contrast to the unanimous verdict of economists that the 10-year would be sharply higher; the average expectation is 3.0% by December. Since the beginning of last year, I have argued the exact opposite and extolled the virtues of owning long-maturity treasuries via the Vanguard Extended Duration ETF (NYSEARCA: EDV ) and/or the Vanguard Long Term Government Bond Index ETF (NASDAQ: VGLT ). The yields on these safer havens have been more favorable than the sovereign debt of beleaguered foreign governments in the developed world. Even today, a 10-year U.S. Treasury at 2.0% compares quite favorably with German bunds (0.5%) and Japanese government bonds (0.3%). A wide variety of international and emerging market stock assets floundered in 2014, and they have continued to descend in the New Year. Yet it may come as a shock to some buy-the-dip enthusiasts that many U.S. stock ETFs have already broken below key support levels. The ones that I have identified in the chart below are currently below 200-day long-term trendlines (exponential). Paradise Lost? U.S. Stock ETFs Begin Falling Below Respective Trendlines % Below 200 Day SPDR Select Energy (NYSEARCA: XLE ) -17.1% Vanguard Materials (NYSEARCA: VAW ) -3.1% SPDR KBW Bank (NYSEARCA: KBE ) -2.0% Market Vectors Morningstar Wide Moat (NYSEARCA: MOAT ) -1.8% Guggenheim S&P 500 Pure Value (NYSEARCA: RPV ) -1.2% WisdomTree Small Cap Earnings (NYSEARCA: EES ) -0.9% RBS U.S. Midcap Trendpilot ETN (NYSEARCA: TRNM ) -0.9% Fidelity Telecom (NYSEARCA: FCOM ) -0.4% RBS U.S. NASDAQ 100 Trendpilot ETN (NYSEARCA: TNDQ ) -0.2% First Trust Internet (NYSEARCA: FDN ) -0.1% While nobody can predict whether the current flight from risk will be yet another head fake – investors have snapped up U.S. stock shares on every 4%-8% pullback since the winter of 2011 – extreme movements in both commodities and currencies in recent months do not bode well for the bulls. For example, dramatic falls in the price of crude oil historically correlate with an increase in geopolitical and economic crises. Does anyone believe that Wall Street can continue to ignore an uptick in overseas strife at the same time that the energy sector is reeling stateside? Similarly, the swift appreciation of the U.S. dollar and the quick depreciation of other world currencies over the last six months is likely to reduce the desire for carry trade activity and/or increase the desire to take some “chips off the table.” In other words, assets like the PowerShares DB USD Bullish ETF (NYSEARCA: UUP ) can be safe havens from stock turbulence, yet the ripple effects can create a desire for a reduction in risk taking across the board and an increase in desire for U.S. Treasury bonds. As an advocate for long-duration treasuries since the first week of January 2014 – as one who wrote at great length about the virtues of a barbell approach in a late-stage stock bull – I decided to investigate the unusually high positive correlation of two of my largest holdings, EDV and the Vanguard Dividend Appreciation ETF (NYSEARCA: VIG ). Historically speaking, treasuries and stocks have a slight positive correlation in good times and a strong negative correlation in bad times. That’s why 2014 represented an unlikely scenario where matching “risk-off” capital preservation with “risk-on” capital appreciation produced risk-adjusted gains that far exceeded stocks alone. Although CNBC would rather talk about the remarkable run in U.S. equities, there has been an unwillingness to address the extraordinary success of “risk-off” assets like EDV. On the contrary. The unanimous expectation for 55 of the leading economists in the country had been for the 3.0% 10-year yield to climb in 2014, with an average projection of 3.4%. It fell to 2.2.% The unanimous decision this time around is for the 10-year to rise from 2.2% to 3.0% in 2015. Alas, it is falling yet again here in the New Year. Granted, I may not be the only contrarian on middle-of-the-yield-curve rates, but I do not run a bond fund and I have plenty of stock exposure. I just know when and how to employ multi-asset stock hedging. Until we see a genuine bear scare, I do not expect tremendous coverage of the index that I helped to create with FTSE-Russell, the FTSE Custom Multi-Asset Stock Hedge Index . I affectionately refer to it as the “MASH” Index. Yet it should be noted that there are a variety of currencies, commodities, foreign bonds and U.S. bonds that have a history of exceptionally low correlations with U.S. stocks. What’s more, low correlations do not mean poor performance when stocks are soaring and great performance when stocks are struggling. It simply means that the assets move independently. That said, month-over-month, the FTSE Custom Multi-Asset Stock Hedge Index (a.k.a. “MASH”) is up 2.5% whereas the Dow logged -2.6%. Year-over-year? MASH gained 6.8% while the Dow picked up 6.3%. Granted, the last month demonstrates that multi-asset stock hedging works particularly well when stocks struggle, but it is hardly a prerequisite. The year-over-year results show that the index can garner admirable gains – better the t-bills or money markets – even in a stock uptrend. An investor can not invest in the FTSE Custom Multi-Asset Stock Hedge Index (MASH) directly yet, though an exchange-traded note is likely to appear in 2015. Do-it-yourself enthusiasts may acquire index components such as zero coupon bonds via the PIMCO 25+ Year Zero Coupon U.S. Treasury Index ETF (NYSEARCA: ZROZ ), the iShares National AMT-Free Muni Bond ETF (NYSEARCA: MUB ) as well longer-dated Treasuries in the iShares 10-20 Year Treasury Bond ETF (NYSEARCA: TLH ). Currencies like the dollar and the franc can be acquired in the CurrencyShares Swiss Franc Trust ETF (NYSEARCA: FXF ) and UUP. The index also includes gold via the SPDR Gold Trust ETF (NYSEARCA: GLD ). Disclosure: Gary Gordon, MS, CFP is the president of Pacific Park Financial, Inc., a Registered Investment Adviser with the SEC. Gary Gordon, Pacific Park Financial, Inc, and/or its clients may hold positions in the ETFs, mutual funds, and/or any investment asset mentioned above. The commentary does not constitute individualized investment advice. The opinions offered herein are not personalized recommendations to buy, sell or hold securities. At times, issuers of exchange-traded products compensate Pacific Park Financial, Inc. or its subsidiaries for advertising at the ETF Expert web site. ETF Expert content is created independently of any advertising relationships. Editor’s Note: This article discusses one or more securities that do not trade on a major exchange. Please be aware of the risks associated with these stocks.

How To Play A Bounce In Oil. Hint: Not USO

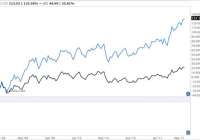
It’s the first (real) week back from holiday break, but the story is the same as it was before Christmas, and before Thanksgiving for that matter…. Crude Oil continues to fall like a lead oil filled balloon, falling below the $50 mark on Monday for the first time since 2009. It’s even gotten to the point of family and friends asking where we think Crude Oil will bottom at parties and dinners, getting our contrarian antennas perked up. The million, or actually Trillion, dollar question is where will Crude finally find a bottom and bounce back? Fortune let us know recently that the $55 drop in Brent Oil prices represents about a Trillion dollars in annual savings. Now, while some are no doubt betting on continued downside with the recent belles of the ball – the inverse oil ETFs and ETNs (the PowerShares DB Crude Oil Double Short ETN (NYSEARCA: DTO ), ProShares UltraShort Bloomberg Crude Oil ETF (NYSEARCA: SCO ) and VelocityShares 3x Inverse Crude Oil ETN (NYSEARCA: DWTI ) ), the last of which is up a smooth 527% since July {past performance is not necessarily indicative of future results}. Others are no doubt positioning for the inevitable rebound in energy prices, thinking it is just a matter of when, not if. Crude Oil is back around $70 to $100 a barrel. And what a trade that would be. Consider a move back to just $75 a barrel, the very low end of where Crude spent the last 5 years, would be a 50% return from the current $50 level. It seems like that could happen nearly overnight without anyone really thinking much about it. So how do you play a bounce in Oil? Well, the most popular play, by size and volume ( $1.2 Billion in Assets , $387 million changing hands daily), is no doubt the The United States Oil ETF, LP (NYSEARCA: USO ) . But is that really the best way to ‘play’ a bounce? Consider that USO Is designed to track the “daily” movement of oil. What’s the matter with that? One would hope that the ETF closely matches the daily move of Oil, right? Well, yes and no. Yes if you are going to buy the ETF for one day, or even a couple of days; no if your investment thesis is oil prices will climb higher over an extended period of time. Because, and here’s where it gets tricky – USO’s long term price appreciation won’t match the sum of its daily price appreciations. What? How is that possible? You see, the ETF works by buying futures contracts on Oil, and there are 12 different contracts in Crude Oil futures each year, you guessed it – one for every month. And while the so called ‘front month contract’ is trading near the number you see on the news every night ($50 yesterday), the further out contracts, such as 10 to 12 months from now, may already reflect the idea that Oil prices will be higher. Indeed, the price for the December 2015 contract is $57, versus $50 for the front month. So there’s $7, or a 14% gain, already “built in” to the futures price. What’s that mean for the ETF investor? Well, if you are correct that Oil will rebound, and it does so, to the tune of rising 14%, or $7 per barrel, over the next 11 months; the ETF likely won’t appreciate 14% as well. It likely won’t move at all, because it will have to sell out of its expiring futures positions and buy new futures positions each month. This means it will essentially have to “pay” that $7 in what’s called “roll costs.” This is why USO has drastically underperformed the “spot price” of Oil over the past five years, with USO having lost -39 % while the spot price of Oil went UP 48 %. It is like an option or insurance premium – a declining asset with all else held equal. Just look at what happened during the last big rally for energy prices between January 2009 and May 2011. That’s a 110% difference between what you thought was going to happen and what the ETF rewarded you with. (click to enlarge) (Disclaimer: Past performance is not necessarily indicative of future results) Chart Courtesy: Barchart So if you think Oil will be higher 3 months from now, or 12 months from now, instead of tomorrow, USO is at best going to give you some discounted version of your expected gain, and at worse a possible loss when Oil gains. (P.S., the ProShares Ultra Bloomberg Crude Oil ETF (NYSEARCA: UCO ) will do all this, times two… yeah) You don’t even have to take our word for it. Take the description of the USO over at ETF.com . USO is a great vehicle for riding short-term moves in expected crude prices, but longer-term holders take on heavy roll risk. Roll costs can be steep when the curve is up-sloping. Ok – so don’t offer a problem without a solution… What other options are out there? Well, in our realm of futures based investments, you could: Trade futures in Crude Oil, Heating Oil, RBOB Gasoline that match your time frame for a rise in prices; rolling them once annually if needed, as we’ve recommended instead of commodity ETFs for some time now. For example, if you think Crude Oil will be higher 12 to 18 months from now, buy the June 2016 Crude Oil futures (currently It will still underperform the pure spot price, but will only pay that roll cost once per year instead of multiple times). Invest with an energy focused professional commodity trading advisor, we have some names. Invest with a trend following manager – who should benefit from a long term trend up (just as they are benefiting from the trend down right now {past performance is not necessarily indicative of future results}, albeit the energy portion would only be a small portion (