Sell Your XLF
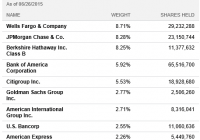
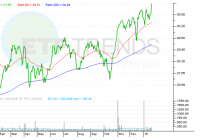
Summary Financials face too many headwinds going forward. Terrible Risk Reward Profile for XLF components. ETF vulnerable to a major sell-off. Quick Background Launched in December, 1998, the Financial Select Sector SPDR ETF (NYSEARCA: XLF ) is an exchange-traded fund comprised of roughly 90 securities with $18.1 billion in assets. It seeks to provide investment results that correspond to the performance of the S&P Financial Select Sector Index and attempts to provide an effective representation of the financial sector of the S&P 500 index. XLF components can be broadly classified as banking (35.5%), insurers (16.5%), real estate (REITs, 15.6%), capital markets (13.8%) diversified financial services (12.7%) and consumer finance (4.9%), as of the end of Q1, 2015. Some Concerns Concentration There is substantial concentration risk in the XLF. The top 3 holdings in the fund, Wells Fargo (NYSE: WFC ), JPMorgan (NYSE: JPM ), Berkshire Hathaway (NYSE: BRK.B ) account for a quarter of the fund’s weighting and the top ten holdings account for almost half (49%). If something goes awry for one of the major components, it would have a very disproportionate effect on the XLF. From the Select Sector SPDR Website : Housing ‘Recovery’ The housing sector has had a great rebound from the depths of the financial crisis. But we think housing is in a countertrend bounce which will work lower once again now that QE and the Feds ZIRP (zero interest rate policy) are ending. Wells Fargo is the main player in this area since it originates about 15% of mortgages in the U.S. and services mortgages with values over $1.7 trillion. Both the originations and servicing metrics are more than Chase and Bank of America (NYSE: BAC ) combined. WFC has rocketed back almost 7.5 fold from the March 2009 lows, or roughly 150% more than the broader averages. When the May numbers for new U.S. single family home sales were released a couple weeks ago, CNBC ran the headline ‘Home Prices near Prior Peak.’ It’s worth noting that Wells Fargo’s stock is about 60% higher now than when house prices peaked in June of 2006 so there is quite a bit of optimism built into that appreciation. WFC directly makes up 8.71% of the fund but if you also add in Berkshire Hathaway’s holdings of Wells Fargo stock, it’s really closer to 11% of XLF. A downturn in the housing sector could disproportionately hurt Wells and the XLF. Let’s not forget that WFC shares lost almost 83% of their value in a seven month stretch during 2008-2009. Even Wells Fargo’s Chief Economist offered some caution at a recent conference when speaking about the San Francisco market and to “put some money aside in the piggy bank.” Derivative Exposure The top 4 investment banks (JPMorgan, Bank of America, Citigroup (NYSE: C ) and Goldman Sachs (NYSE: GS )) hold 91.3% of the total derivatives outstanding ($185 trillion of the $203 trillion outstanding as of Q1 2015), according to the Office of the Comptroller of the Currency, OCC . The combined total assets for these 4 banks are just over $5 trillion which represents just 2.7% of their derivative exposure. I went and took just the cash and cash equivalents of these big 4 banks from the end of the first quarter of 2015 from Yahoo Finance and the sum was $1.97 trillion which represents just 1% of their total derivative exposure. If there is some type of shock to the system (Lehman Brothers, Bear Stearns) with derivative exposure compared to their assets this stretched, these firms are dangerously undercapitalized. Total notional value of all OTC derivatives is $710 trillion, according to the Bank for International Settlements. Granted this is worst-case scenario numbers and netting effects will mitigate much of this exposure but even if a fraction of the exposure goes awry (counterparty or a clearing firm gets into trouble) it would have a serious effect on these firm’s capital base. Just these top 4 investment banks make up 22.5% of XLF. XLF’s second largest holding, JPMorgan has derivative exposure of $52.4 trillion which is 25 times larger than its asset base of $2.1 trillion. (click to enlarge) The exposure for Goldman Sachs is truly worrisome. They rank #3 in total notional derivatives with $44.51 trillion which is a jaw-dropping 348 times larger than their total asset base, $127.77 billion, according to the OCC’s quarterly report. Goldman Sachs survived the financial crisis by (arguably) getting on the short side. Who knows if they will be able to hedge so well again with all the prop trading restrictions? The lines between market-maker and prop trader will be more severely scrutinized this time around. Goldman has made it through the financial crisis (the stock had recovered 87% of its pre-crisis value) but I think the ire of many will be directed towards Goldman the next time around, especially post ‘Muppet-Gate.’ Lastly, Goldman’s value-at-risk, VaR, measured relative to equity is very low at only a tenth of one percent, according to the OCC report. We worry this is understated because 1- they report their VaR at only a confidence level of 95% (versus Banc of America or Citigroup who disclose at a more stringent 99%) and 2- the VIX has been at very low levels for three straight years now, with only the occasional spike which is quickly retraced. VaR tends to follow the VIX and we think a large VIX increase, and more importantly, a more sustained increase is imminent. Even though the VIX has started to move up again, there is still more complacency shown than in prior spikes (the open interest in the VIX’s put-call ratio has barely budged higher). This non-confirmation indicates the VIX could have much more to run. These VaR measures are deceivingly for many of the banks, not just Goldman. They didn’t help during the financial crisis and I doubt they’ll help much during another one. Given the degree of concentration among the three largest holdings in XLF, we must mention Berkshire Hathaway. The conglomerate, with such classic brands as Coca-Cola (NYSE: KO ), Kraft (KRFT) and GEICO, has been run by an absolute legend-two actually. But it’s portfolio of blue chips and now an increased position in cyclical industries like railroads (the Burlington-Northern purchase) leave it susceptible to an economic downswing also. Even Berkshire’s portfolio wasn’t immune to the financial crisis that lopped 57.5% off its shares in 7 months, from a high in December 2007 ($101.18) to a low of $42.95 in July of 2008. It chopped around feverishly and then almost retested the low with the market, reaching $45.02 in March of 2009. Real Estate REITs are especially vulnerable going forward simply because they have been such a crowded trade in the hunt for yield during the ZIRP era. The REIT with the largest weighting in XLF is Simon Property Group (NYSE: SPG ), the giant shopping mall REIT. The U.S. consumer is struggling and shopping malls should prove to be one of the tougher roads ahead in the REIT space. Famed bond investor Jeffrey Gundlach of Doubletree warns of mall REITs and says “we’re in a secular death spiral for malls.” This REIT lost roughly 80% of its value in the financial crisis and that’s as rates were being lowered. What will happen if there’s stress and rates rise? We believe eventually rates will rise for the wrong reasons (not growth in the economy) but because investors will demand more interest for the risk of owning the various country’s or company’s bonds. When they do start to rise, there will be more competition against the alphabet soup of so-called “bond equivalents” high yielders (REITs, MLPs, BDCs, etc.) Insurance Insurers are in a riskier position than many believe. Insurance companies have been so hard-pressed to match their liabilities in a ZIRP environment they’ve been forced to take on all kinds of risky toxic securities in a hunt for yield. Their book values could get decimated when various classes of bonds, junk bonds in particular (insurance company investment portfolio staples) unravel. Life insurers are especially vulnerable ( MetLife, Inc. ( MET) and Prudential Financial, Inc. ( PRU)), both high on XLF’s list. On CNBC , Stanley Druckenmiller, the former partner with George Soros from the famous trade that broke the Bank of England has been mentioning some reservations regarding the corporate bond market. He warns that from the prior high in 2006, 28% of issued debt was B-rated, now its 71%. Covenant lite loans made up 20% of all loans in 2006/2007 and now that number is over 60%. The Barclay’s U.S. Corporate High Yield Spread will be a key metric to watch and if we break above last winter’s peak of 550, it could be off to the races for the spreads to start widening out more severely. This will be bad news for the XLF. The current consensus is that interest rate rises are good for banks because of the net interest margin increases. The net interest margin has as much to do with the shape of the yield curve as the direction of rates. When short-rates rise much faster than long rates, it doesn’t necessarily increase the net interest margin- it portends trouble. We think rates of all durations will work higher, quicker than many think, and any increase in NIM will be offset by credit concerns. A fantastic article on Seeking Alpha was recently written by Donald van Deventer talking about banks, life insurers and reinsurers and higher rates. Here is an excerpt from the article that illustrates that these entities are mostly negatively correlated to rising interest rates, measured against a set of 11 different U.S. Treasury maturities covered by Yahoo Finance: (click to enlarge) Empirical evidence shows that insurance stocks (and bank stocks in his other article) are, in fact, more negatively correlated to rate rises, contrary to what seems to be new conventional wisdom. I highlighted two ‘Top Ten’ holdings of XLF. I believe there is so much built in optimism in the market that almost all data points are being used only for opportunistic purposes without precaution. It’s been quite a long time since we’ve had a sustained uptrend in rates so there’s no telling how this may play out (especially with at least $59 trillion in dollar-denominated debt outstanding in the U.S. and roughly $200 trillion worldwide, see chart from McKinsey report below.) Regulatory The drumbeat of more regulation and fines from the financial crisis seem never-ending. So far, over a quarter trillion dollars have been paid by the big banks for various wrongdoings since the financial crisis. That should continue. We believe another whole round will begin and the ‘hedge clipper’ movement will continue to gain strength. When the market turns down again, populist opinion will accompany the rhetoric and amplify. Hillary Clinton’s campaign has already started the anti-hedge fund/Wall Street talking points and has even hired Gary Gensler, former top federal regulator and CFTC head, as her campaign CFO. A victory for Hillary could mean that this strict enforcer of Wall Street rules could be back in the spotlight. The greater the gap between the 1% and everyone else, the louder and longer this will continue. Many of the names in the XLF are also on the government’s SIFI list which will be a real chain around them in the next downturn, forcing them to maintain various liquidity standards and potentially refrain from ‘riskier’ (and more profitable) activities. More than any other sector, the large financials will be forced to add ever more capital by selling off assets or issuing their own equity to protect the solvency of the financial system. At least twelve XLF components are on the SIFI list, including Wells Fargo, JPMorgan, Goldman, Bank of New York Mellon (NYSE: BK ), Citigroup, State Street (NYSE: STT ), Morgan Stanley (NYSE: MS ) and Bank of America. Non-financial XLF components such as MetLife, Prudential and AIG (NYSE: AIG ) also make the list. Some companies are appealing the designation. The list could extend to asset managers, prime brokers or whoever the government deems too risky to fail in the future. This will eventually mean less lending, whether for individuals or institutions (including hedge funds). The names in the XLF will be the names probably on that list. This should remain another headwind going forward. XLF price target We have a 12-month price target for XLF at $19.75 which represents an approximate 20% discount to current share price. This downside is conservative. We modeled various assumptions including equity market sell-offs (12% U.S. equity market sell-off), interest rate rises (the 3-month LIBOR at 35 basis points, the 30-yr fixed mortgages of 4.50%, the U.S 10- year Treasury above 3%) and U.S. unemployment rate moving higher (to 5.8%, U-6 rate up to 11.3%) and a bottoming of the delinquency rate on Commercial Real Estate (FRED’s ‘DRCR’). Catalysts The main catalyst will be a sell-off in global financial markets or a macro ‘event’ that gets the ball rolling (as I’m finishing this article I see the Greece referendum has just come in with the “No” vote to further austerity prevailing). It won’t be the event specifically; the market environment is long overdue for any excuse to sell. Unlike during the financial crisis, rates don’t have further room to go down so they should actually rise during this sell-off, if for no other “reason” than funds selling the most liquid positions (Treasuries) in a time of turmoil. The extent to the crowding of the bond buying trade of the last few years (resulting in negative sovereign yields, record low junk bond yields, etc) leaves plenty of room for a sustained bond market correction that lasts for years. This will exacerbate the problem for all the various subsectors of the XLF (banking, insurance, real estate, etc). Summary Combine interest rates bottoming off a thirty year downtrend with global debt and derivative exposure pushing one quadrillion dollars and you have a highly actionable time to lessen exposure to financials and/or to sell the Financial Select Sector SPDR Fund .The risk-reward profile is very unattractive at these levels and we think XLF should be sold, reduced, or hedged. The chart below shows a similar pattern in the run up in XLF shares in 2015 compared to 2007. Observe the narrow monthly trading ranges for an extended period of time (about three years) during this run up to now. This ‘calmness’ is not the sign of healthy price action, and the lack of volatility should unwind itself swiftly. In closing, here is a look at what we believe can happen again to XLF: (click to enlarge) Disclosure: I/we have no positions in any stocks mentioned, and no plans to initiate any positions within the next 72 hours. (More…) I wrote this article myself, and it expresses my own opinions. I am not receiving compensation for it (other than from Seeking Alpha). I have no business relationship with any company whose stock is mentioned in this article. Additional disclosure: This is not an investment recommendation and I/we are not a registered investment advisor.