Tag Archives: function

UNG Remains Around $15 – Will It Recover?
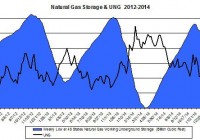
Summary The natural gas storage is projected to be lower than normal by the end of March. The short-term weather outlook is uncertain, but suggests warmer-than-normal weather, which could bring UNG back down. The extraction from storage is expected to be lower than normal this week. The price of The United States Natural Gas ETF (NYSEARCA: UNG ) ended the year with another tumble, as it dipped below $15 at one point. Currently, the price is around $15 – the lowest level UNG reached in the past couple of years. The high uncertainty around the weather forecasts for January didn’t stop investors from pulling out of UNG. The hotter-than-normal weather and slow rise in production maintains UNG at its current low level. Keep in mind, however, the natural gas storage is still low for the season, and is likely to remain low by the end of March. Storage extractions remain slow The last few storage reports showed that the extractions were very low for this time of the year. We could start seeing a trend developing in recent weeks. The chart below presents the changes in the natural gas underground storage and the price of UNG in the past couple of years. (Data Source: EIA, Google Finance) As you can see, the slope in storage this winter seems less steep than in previous winters. This could indicate that the natural gas market doesn’t heat up as it did last winter. The natural gas futures markets also show a trend – the once-high Backwardation for the four-month contracts recorded at the end of November has almost entirely dissipated. Currently, the future markets are mostly still in Backwardation, however, the gaps are very small. (Data Source: EIA) So the markets still expect a modest gain, at best, in the price of natural gas in the near term. After all, the EIA still expects the spot price to average at $4 during January. Long-time investors in natural gas know that this market view could change very promptly if the weather conditions change or any other unexpected event were to come to fruition. Looking forward, the EIA projects inventories will reach to 1,431 Bcf by the end of the extraction season (the end of March), which is still 225 Bcf below the 5-year average. Some analysts still expect the storage levels will rise to 4,000 Bcf by the end of the year – I remain skeptical about this outlook. Next week’s extraction from storage is likely to be lower than normal again, because last week’s deviation from normal temperatures was, on average, 7.12. This measurement tends to have a strong positive correlation (0.62) with the changes in the gap between the 5-year average extraction and current extraction. Another issue to consider is the ongoing growing natural gas production – current estimates are for a 3.1% gain in output in 2015, year over year. This growth rate will be slower than in 2014, but will still reduce the pressure on UNG prices. The rise in production continues, albeit the number of rigs remains low: Based on the recent update from Baker Hughes , the natural gas rotary rig count rose by 2 rigs to reach 340 rigs – nearly 9% below the levels recorded back in 2013. The drop in natural gas prices also had an adverse impact on natural gas producers such as Chesapeake Energy (NYSE: CHK ) – the company’s stock dropped by 11% during the past couple of months. For Chesapeake Energy, the plunge in oil prices also took its toll on its stock in recent weeks. Over the next two weeks, temperatures are expected to be above normal in the west and normal in other parts of the U.S., including the Northeast and the Midwest. Based on the National Oceanic and Atmospheric Administration , January’s weather remains highly uncertain, however. By the middle of January, the NOAA projects higher-than-normal temperatures in many parts of the U.S., including the West and the Northeast. NOAA also estimates below-normal temperatures in some regions, such as central and southern Great Plains. The hotter-than-normal weather and the slow extraction from storage are keeping UNG down. But the natural gas market won’t need much to drive UNG back up, including sharp changes in weather, a slowdown in output or a rise in the pace of depletion. For more see: ” Is Chesapeake Regaining Our Confidence? ”
Major Asset Classes Dec. 2014 Performance Review

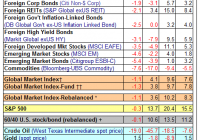
U.S. real estate investment trusts (REITs) led the performance race in December among the major asset classes, rising a healthy 1.9% in the final month of 2014, based on the MSCI REIT Index. U.S. REITs were also the top performer for the calendar year among the major asset classes. For the rest of the field, returns in December were mostly flat to negative. The big loser last month and for 2014 as well: commodities, broadly defined (Bloomberg-UBS Commodity Index). The U.S. stock market was flat last month, although for year just passed U.S. equities earned a respectable 12.6% (Russell 3000). That’s a comparatively soft gain relative to the stellar advance for U.S. market in the last few years, but it’s above average in comparison with long-term results. Meanwhile, portfolio diversification faced strong headwinds last month and for 2014 overall. The Global Market Index (an unmanaged benchmark that holds all the major asset classes in market-value weights) retreated 1.1% in December. For all of 2014, GMI earned a relatively soft 4.1% – a sharply lesser gain vs. 2013’s 14.2% advance. GMI’s diminished performance last year is disappointing in the context of recent history, but the downsizing of return isn’t particularly surprising. Forward-looking risk-premia estimates for GMI have been in the neighborhood of 4.0% lately (see last month’s update, for instance). By contrast, GMI’s historical risk premiums have been running at roughly twice that pace in the last several years, based on the trailing three-year period. But as December’s numbers suggest, the wide gap between hefty profits in the rear view mirror and lean expectations for the future is closing. The implication: minting impressive returns with a passively managed multi-asset class strategy is going to get tougher in the foreseeable future. The solution for sidestepping softer results? The standard toolkit, of course – excelling in rebalancing and/or second-guessing Mr. Market’s asset allocation. In other words, generating a portfolio return that’s comparable to what we’ve seen over the past five years will probably require a higher dose of risk. Now that you’ve read this, are you Bullish or Bearish on ? Bullish Bearish Sentiment on ( ) Thanks for sharing your thoughts. Why are you ? Submit & View Results Skip to results » Share this article with a colleague

FNDF Has Great Risk Factors And Enough Liquidity, But I Really Dislike The Cash Position

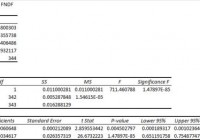
Summary I’m taking a look at FNDF as a candidate for inclusion in my ETF portfolio. The extremely low correlation with other major funds (like SPY) is great and holds up despite a decent time frame and high volume of trades. The expense ratio is a bit high for my liking and is combined with a fairly large position in cash. Investors should treat cash in an ETF as a savings account that charges them an expense ratio instead of paying interest. I’m not assessing any tax impacts. Investors should check their own situation for tax exposure. Investors should be seeking to improve their risk adjusted returns. I’m a big fan of using ETFs to achieve the risk adjusted returns relative to the portfolios that a normal investor can generate for themselves after trading costs. I’m working on building a new portfolio and I’m going to be analyzing several of the ETFs that I am considering for my personal portfolio. One of the funds that I’m considering is the Schwab Fundamental International Large Company Index ETF (NYSEARCA: FNDF ). I’ll be performing a substantial portion of my analysis along the lines of modern portfolio theory, so my goal is to find ways to minimize costs while achieving diversification to reduce my risk level. What does FNDF do? FNDF attempts to track the total return of the Russell Fundamental Developed ex-U.S. Large Company Index. Normally at least 90% of the assets are invested in funds included in this index, but there appears to be some leeway under unusual market conditions. FNDF falls under the category of “Foreign Large Value.” Does FNDF provide diversification benefits to a portfolio? Each investor may hold a different portfolio, but I use the SPDR S&P 500 Trust ETF (NYSEARCA: SPY ) as the basis for my analysis. I believe SPY, or another large cap U.S. fund with similar properties, represents the reasonable first step for many investors designing an ETF portfolio. Therefore, I start my diversification analysis by seeing how it works with SPY. I start with an ANOVA table: (click to enlarge) The correlation is only 82%, which is very solid for modern portfolio theory. Extremely low levels of correlation are wonderful for establishing a more stable portfolio. I consider anything under 50% to be extremely low. However, when I see those values it usually comes with issues, such as low average volume, which can create distorted statistics. For an ETF with around 184,000 shares trading hand each day, the 82% is very impressive. Standard deviation of daily returns (dividend adjusted, measured since August 2013) The standard deviation is pretty good. For FNDF it is 0.8055%. For SPY, it is 0.6891% for the same period. SPY usually beats other ETFs in this regard. If an ETF is only 0.10% to 0.15% over SPY with heavy trading volume it is doing fairly well for stability. Mixing it with SPY I also run comparisons on the standard deviation of daily returns for the portfolio assuming that the portfolio is combined with the S&P 500. For research, I assume daily rebalancing because it dramatically simplifies the math. With a 50/50 weighting in a portfolio holding only SPY and FNDF, the standard deviation of daily returns across the entire portfolio is 0.7135%. With 80% in SPY and 20% in FNDF, the standard deviation of the portfolio would have been 0.6898%. If an investor wanted to use FNDF as a supplement to their portfolio, the standard deviation across the portfolio with 95% in SPY and 5% in FNDF would have been 0.6881%. Why I use standard deviation of daily returns I don’t believe historical returns have predictive power for future returns, but I do believe historical values for standard deviations of returns relative to other ETFs have some predictive power on future risks and correlations. Yield & Taxes The distribution yield is 0.50%. Retirees seeking yields won’t find them here, but the low correlation still looks good for investors that don’t need strong yields. I’m not a CPA or CFP, so I’m not assessing any tax impacts. Expense Ratio The ETF is posting 0.32% for an expense ratio. I want diversification, I want stability, and I don’t want to pay for them. The expense ratio on this fund is higher than I want to pay for equity securities, but not high enough to make me eliminate it from consideration. Market to NAV The ETF is at a 0.85% premium to NAV currently. Premiums or discounts to NAV can change very quickly so investors should check prior to putting in an order. I don’t want to pay a premium over 0.2%, and this premium has persisted despite a respectable amount of daily volume. I don’t see these premiums as sustainable over the long term, so I would be concerned about entering a position without seeing the premium drop first. Largest Holdings The diversification within the ETF is pretty good, so long as we only look at the equity securities. (click to enlarge) I’m not big on the holdings including a 10% value for U.S. dollars. I have nothing against dollars, but I already have them in my checking and savings account. Neither of those accounts are charging me an expense ratio. Conclusion I’m currently screening a large volume of ETFs for my own portfolio. The portfolio I’m building is through Schwab, so I’m able to trade FNDF with no commissions. I have a strong preference for researching ETFs that are free to trade in my account, so most of my research will be on ETFs that fall under the “ETF OneSource” program. For the level of liquidity, the low correlation is great. However, I’m not comfortable investing at a significant premium to NAV and with the high volumes of trades the bid-ask spread may be tight enough that I wouldn’t have a very good shot of triggering a limit buy order at the price I would want to use. Even if I put those issues aside, I’m not big on buying into an ETF with a pile of cash earning an expense ratio. I have quite enough exposure to cash through my bank accounts without having an ETF hold it for me. Additional disclosure: Information in this article represents the opinion of the analyst. All statements are represented as opinions, rather than facts, and should not be construed as advice to buy or sell a security. Ratings of “outperform” and “underperform” reflect the analyst’s estimation of a divergence between the market value for a security and the price that would be appropriate given the potential for risks and returns relative to other securities. The analyst does not know your particular objectives for returns or constraints upon investing. All investors are encouraged to do their own research before making any investment decision. Information is regularly obtained from Yahoo Finance, Google Finance, and SEC Database. If Yahoo, Google, or the SEC database contained faulty or old information it could be incorporated into my analysis. The analyst holds a diversified portfolio including mutual funds or index funds which may include a small long exposure to the stock.