The Lesson From PXMC: Investors Shouldn’t Rely On Average Trading Volume
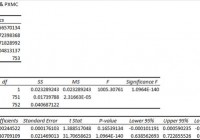
Summary I’m taking a look at PXMC as a candidate for inclusion in my ETF portfolio. Looking at the liquidity by the average trading volume is misleading in this case. Looking at number of days where no shares traded hands provides a different picture. I like the ETF for being intelligently designed, but I can’t accept the combination of expense ratios and poor liquidity. Investors should be seeking to improve their risk-adjusted returns. I’m a big fan of using ETFs to achieve the risk-adjusted returns relative to the portfolios that a normal investor can generate for themselves after trading costs. I’m working on building a new portfolio and I’m going to be analyzing several of the ETFs that I am considering for my personal portfolio. One of the funds that I’m considering is the PowerShares Fundamental Pure Mid Core Portfolio ETF (NYSEARCA: PXMC ). I’ll be performing a substantial portion of my analysis along the lines of modern portfolio theory, so my goal is to find ways to minimize costs while achieving diversification to reduce my risk level. What does PXMC do? PXMC uses an indexing approach to track the performance of the RAFI® Fundamental Mid Core Index. The ETF falls under the category of “Mid-Cap Blend.” Does PXMC provide diversification benefits to a portfolio? Each investor may hold a different portfolio, but I use SPDR S&P 500 Trust ETF (NYSEARCA: SPY ) as the basis for my analysis. I believe SPY, or another large cap U.S. fund with similar properties, represents the reasonable first step for many investors designing an ETF portfolio. Therefore, I start my diversification analysis by seeing how it works with SPY. I start with an ANOVA table: (click to enlarge) The correlation measured on a daily basis is beautiful at just over 76%. I want to see low correlations, and that is exactly what I’m finding in PXMC. However, the reliability of that correlation depends on the liquidity of the ETF. If shares aren’t trading hands, no change in price is recorded, and it appears that the value was steady even if the net asset value was changing in correlation with SPY. Standard deviation of daily returns (dividend adjusted, measured since January 2012) The standard deviation is mediocre. For PXMC it is .818%. For SPY, it is 0.736% for the same period. SPY usually has a lower level of standard deviation than other ETFs, so being a little bit above SPY isn’t too bad. With the low correlation, the ETF could still do fairly well under Modern Portfolio Theory. Why I use standard deviation of daily returns I don’t believe historical returns have predictive power for future returns, but I do believe historical values for standard deviations of returns relative to other ETFs have some predictive power on future risks and correlations. Liquidity is inconsistent The average trading volume can change dramatically depending on when investors look at it. Unfortunately, the volume can spike quite substantially. Over the 3 year time period, the average trading volume is under 1,500 shares per day. However, there are also days where over 40,000 shares change hands. In my opinion, this is a fairly dangerous liquidity situation for investors. Yield The distribution yield is 1.26%. For such an illiquid ETF, a higher distribution yield would be fairly nice for investors that were seeking to see some income from their position. The poor liquidity doesn’t bode well for investors that have to sell portions of their position to generate income. Expense Ratio The ETF has a net expense ratio of .39% and a gross expense ratio of .69%. The net expense ratio isn’t too bad, as long as it doesn’t eventually change to reflect the gross expense ratio. Market to NAV The ETF is at a .08% premium to NAV currently. When I first looked at the ETF a few weeks ago, it was trading at a .05% discount to NAV. A price swing of .13% in a few weeks wouldn’t bother me at all, but I am concerned when the discount or premium to NAV can swing that way. It reinforces my concerns about liquidity. I wouldn’t feel comfortable trading on this unless I was very confident that I had up to the minute data on the NAV. Largest Holdings The diversification is pretty good in this ETF. (click to enlarge) Conclusion I haven’t found much luck in finding a mid-cap portfolio that really appeals to me. I would love for this to be the one, but I don’t trust the statistics after seeing the poor liquidity. The average trading volume would make investors believe it held some liquidity, if they happened to look shortly after one of the spikes in volume. However, the 71 days with 0 trading volume create a real concern for me. If those days were largely behind the ETF, I wouldn’t be willing to move past it as well. However, upon closer inspection only 47 of the days had occurred before January of 2014. The other 24 days had to occur within 2014. That’s a substantial portion of the trading days. The holdings have reasonable diversification and the performance hasn’t been bad. If I thought I could leverage the poor liquidity into a meaningful discount on an entry position, then I would find that quite appealing. However, with the volume being 0 on so many days I don’t think there are many sellers willing to cross a large spread and sell at a meaningful discount to NAV. I might find the ETF fairly appealing if I was able to immediately locate deviations from NAV in real time, but I’m not looking for that level of complexity in entering a position. In a year or two, I may be looking to experiment in that realm and I would definitely consider this ETF again at that point. On the other hand, if the ETF’s liquidity improved, I would find that very appealing and would want to take another look at the ETF and test the correlation again without so many days with a volume of 0. The PowerShares portfolios I have looked at recently have had higher expense ratios, but the selection of securities seemed to be intelligent and the performance history has held up. I like those factors and would consider handling poor liquidity or a high expense ratio, but not both. Disclosure: The author has no positions in any stocks mentioned, and no plans to initiate any positions within the next 72 hours. (More…) The author wrote this article themselves, and it expresses their own opinions. The author is not receiving compensation for it (other than from Seeking Alpha). The author has no business relationship with any company whose stock is mentioned in this article. Additional disclosure: Information in this article represents the opinion of the analyst. All statements are represented as opinions, rather than facts, and should not be construed as advice to buy or sell a security. Ratings of “outperform” and “underperform” reflect the analyst’s estimation of a divergence between the market value for a security and the price that would be appropriate given the potential for risks and returns relative to other securities. The analyst does not know your particular objectives for returns or constraints upon investing. All investors are encouraged to do their own research before making any investment decision. Information is regularly obtained from Yahoo Finance, Google Finance, and SEC Database. If Yahoo, Google, or the SEC database contained faulty or old information it could be incorporated into my analysis. The analyst holds a diversified portfolio including mutual funds or index funds which may include a small long exposure to the stock.