Equity CEFs: Will 2015 Be The Year Of The Rotation? Part II
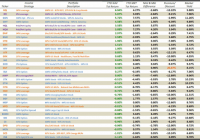
Summary Recently, I wrote an article offering what equity based CEFs might benefit from a sector rotation from the leaders over the last few years to some of the laggards. Though there have been fits and starts so far in January, and certainly 1-month does not make a trend, indications are that a rotation could very well be afoot. The bigger risk is that the end of Quantitative Easing will see a contraction in all asset prices across all sectors. Over the last few years, your best bet in fund investing would have been just to buy the biggest and most popular US based broad market index ETFs, such as the SPDR S&P 500 Trust (NYSEARCA: SPY ) , the PowerShares NASDAQ-100 (NASDAQ: QQQ ), the SPDR Mid-Cap 400 (NYSEARCA: MDY ) or the iShares Russell 2000 (NYSEARCA: RWM ) and forgot about them. Certainly there have been even better performing funds and ETFs that focused in sectors such as healthcare or biotechnology, but for mindless “invest and forget” funds, you could not go wrong with the most popular broad market US indices and any of the many ETFs that correlate with them. Because the vast majority of actively managed mutual funds and professional money managers have had a very difficult time competing with these US indices. The traditional fundamental stock analysis that many active portfolio managers relied on for alpha performance simply was overwhelmed by the massive amounts of liquidity and/or computer algorithm trading that benefited the largest and most liquid ETFs. The ramp up in these indices really began in 2012 and so here are the total returns of these four popular major market ETFs since then through January 30th, 2015. Index ETF Ticker Total Return SPDR S&P 500 SPY 67.1% PowerShares NASDAQ-100 QQQ 86.8% SPDR Russell Mid-Cap MDY 68.6% iShares Russell Small-Cap IWM 63.1% NOTE: The actual indices do not include dividends whereas these ETFs and others like them do. So total return means all dividends are added back to the ETFs but not on a reinvested basis. In addition, the NASDAQ-100 represents the largest 100 non-financial stocks listed on the NASDAQ and thus, holds far fewer stocks than the actual NASDAQ . And finally, there is also a lot of overlap in the technology dominated NASDAQ-100 and the S&P 500, as there would be with say, the Dow Jones Industrial Average (NYSEARCA: DIA ), whose 30 blue chip stock constituents would all be included in the S&P 500. Of course, this does not mean that all of the stock constituents in these indices have done this well and if you separated them out by sector, you would find that stocks in certain sectors, such as technology and healthcare, have far outperformed almost all of the other sectors, many of which may have shown one or two underperforming years or even negative years since 2012. Nonetheless, it’s unusual to see three straight years in which all market capitalizations have done this well even though the Russell Small Cap Index did not have nearly as good a 2014 as in the previous two years. But is there a reason for this mostly consistent performance over the last few years across all market capitalizations? Well, of course there is. The reason was the Federal Reserve’s Quantitative Easing which injected massive amounts of liquidity to financial institutions by buying bonds and other fixed-income assets. Though Quantitative Easing started well before 2012, much of the early liquidity brought more stability and traction to the markets rather than inflating them. But at some point, this sustained liquidity started to inflate the markets across all segments because if you were a financial institution that had excess liquidity you needed to put to work, the easiest way to invest it would be to throw it into the largest and most liquid ETFs. So Will 2015 Be The Year Of The Rotation? I’m not trying to imply that everything changes in a new year but there are certainly reasons why 2015 could easily be much different than the past three years. The biggest reason is Quantitative Easing ending in October, 2014 so the simplistic throw your money at the largest and most liquid broad based index ETFs is over. What this means is that financial institutions and other asset managers are going to have to start working harder to find places to invest and that bodes well for more individual stock and sector investing rather than index investing. In other words, the air in the balloon is not hooked up to the pump anymore and investors now have to put their fingers to the wind to find which way it is blowing. And that’s why I believe 2015 is setting up better for a rotation out of some of the high flying sectors over the last few years and into some of the more underperforming sectors, though certainly economic and geopolitical factors will play a huge role in which sectors perform better or worse. This was the basis of my article I wrote in late December, titled Will 2015 Be The Year Of The Rotation? Now I have no idea how the markets will perform in 2015 and it could be a down year for all sectors, but I felt pretty confident coming into the new year that we would see a sector rotation at least in the beginning of the year, and that one of the best ways to play that would be in equity CEFs because of their built-in valuations. If you go to the link above, I identified two equity CEFs in particular, the Gabelli (GAMCO) Global Gold, Natural Resource and Income Trust (NYSEMKT: GGN ) , $7.46 market price, $7.49 NAV, -3.0% discount, 11.3% current market yield , and the Gabelli Natural Resources, Gold and Income Trust (NYSE: GNT ) , $8.49 market price, $9.07 NAV, -6.4% discount, 10.0% current market yield , that I felt would be excellent rotational CEFs not just because of the sectors they invest in but also because of their valuations that tended to spike one direction at the end of one year only to spike the other direction at the beginning of the next. As it turned out, global geopolitical forces have also helped GGN and GNT since these funds invest mostly in gold sector stocks which have performed better, though energy and natural resource stocks remain weak. But as you’ll see in the table below, some sectors, such as healthcare, utilities and REITs continue to do well even after a very strong 2014. On the other hand, the technology and financial sectors have come under pressure so far this year. In other words, rotations can have fits and starts and nothing is a guarantee to move on your timetable. Here are the top performing equity CEFs I follow sorted by total return NAV performance YTD through January 30th, 2015. (click to enlarge) As you can see, GGN and GNT are among the top NAV and market price performers so far in 2015 and if you had actually invested in these gold and energy focused CEFs on the date I released my article, you would be up an even more impressive 11.4% in GGN and 6.5% in GNT . By comparison, the S&P 500 is down -3.0% YTD. so there are quite a number of equity CEFs that are already ahead of S&P 500 shown in the table above (only 30 can be shown in a screen shot. So why do I think this trend will continue? Because when you see a bellwether stock like Microsoft (NASDAQ: MSFT ) drop -14.4% in 1-week on heavy volume, that is more than just a road bump on the way to new highs, in my opinion. That is institutional investors lowering their weightings and expectations going forward not just for MSFT but for technology in general I would expect. Now the other alternative is that we’re in for something far worse and that no sector will be safe. The weakness in the financial sector is probably the most unsettling since this is where the seeds of something more ominous usually begin. But for now, I believe that the most popular sectors over years past are not going to be the leaders in 2015 and that investors will be looking more towards out-of-favor sectors and even overseas markets to provide better opportunities. Undervalued Equity CEFs Don’t Need Positive News To Turn It Around But It Sure Can Help In 2013, I strayed from my usual focus on equity CEFs and wrote several articles on Municipal Bond CEFs. If you didn’t follow what was going on with municipal bonds that year, let’s just say the news out of Detroit, Puerto Rico, Illinois and other municipalities was creating one of the worst years for muni bond funds and a downright bear market for muni bond CEFs, many of which dropped from premium valuations to double digit discounts in one year. However, at the end of 2013 I wrote this article, The Sad State Of Muni Bond CEFs , and said the worst was mostly reflected in their valuations and to start buying these funds even ahead of any tangible positive news flow. In hindsight, I wish I had bought even more muni bond CEFs as they have been one of the best fund investments I have owned since then. The point is, you don’t have to wait for positive news when buying CEFs, you just have to know when their valuations make their risk/reward too good to pass up. Geopolitical events are already beginning to help some of the down and out sectors so far in 2015 and as I’ve said, valuations of funds can often provide the best support for their market prices even if the sectors they invest in have yet to recover. We’re already seeing this in many of the energy related CEFs and energy MLP CEFs even while oil and energy prices remain weak. One extreme example of this is the BlackRock Energy and Resources fund (NYSE: BGR ) , which has magically risen from a -10% discount not long ago to an 8.1% premium. (click to enlarge) Not sure what’s behind the interest in BGR but it provides a good example of what can happen to more thinly traded securities like CEFs when a little confidence returns to a sector or when investors try and get ahead of the curve. Even many of the energy MLPs are seeing better valuations so far this year despite most energy prices remaining in a downtrend. So imagine what can happen when a few geopolitical or economic events start to turn in favor of your rotational sectors. One of the biggest news so far in 2015 was the announcement by the European Central Bank to begin their own Quantitative Easing program which has helped gold prices and brought renewed interest in European stocks. This was the basis of my last article, Global CEFs For A QE Europe . Conclusion Are we seeing the seeds of rotation in the markets? I believe we are and in my Part III article, I will go over the equity CEFs that I think will be primary beneficiaries. Disclosure: The author is long GGN, GNT. (More…) The author wrote this article themselves, and it expresses their own opinions. The author is not receiving compensation for it (other than from Seeking Alpha). The author has no business relationship with any company whose stock is mentioned in this article.