Tag Archives: nysearcaxle

XLE: Energy Stocks Still Overvalued Relative To The Oil Price

Oil may find a bottom this fall at $35-$40 — but that doesn’t mean oil stocks will find a bottom. The XLE energy stock ETF remains highly inflated, as compared with the oil price. Oil and the broader stock market have been trading together since volatility spiked in August. If the S&P 500 goes down another leg to the 1680 range this fall, XLE will fall even farther than the S&P and the oil price will. Don’t buy oil stocks yet — in fact, consider shorting XLE. Ever since the oil price crashed in the fall of 2014, investors have been trying to call a bottom and find an opportunity to invest in the energy sector at bargain values. But so far, the market has frustrated would-be value investors in energy, as the oil price and energy stocks of all types have continued to fall farther and farther. The low to date was reached in the market selloff of August 24-25, when WTIC oil settled at $38.22 and the Energy Select Sector SPDR ETF (NYSEARCA: XLE ) fell to $59.22. Some investors are now hopeful that these prices were the bottom that they have been waiting for, and they think now is finally the time to buy energy stocks and make big profits on the oil price rebound in the coming years. I believe they are half right, but unfortunately it is not the most profitable half. The oil price itself was probably very close to the bottom when it fell into the $37-$40 range for a few days, below $40 for the first time since February 2009. But the large-cap and mid-cap energy stocks in XLE probably have a lot farther to fall. XLE was in the low $40s in February 2009, and it could fall another 33% from its current price before it reaches that level again. The point is that large-cap and mid-cap energy stock prices are influenced both by the oil price and by the performance of the broader stock market in general. Their prices were very low in February 2009 because the oil price and all stock prices were very low. Their prices held up relatively quite well from fall 2014 through spring 2015 because the whole stock market was holding up well then. Investors had confidence that the big oil companies would ride out the oil price drop and continue to prosper along with the entire economy when oil prices recovered. But since the return of volatility in all markets since August, oil stocks no longer have the assurance of the broader market to fall back on. Stocks have dropped decisively from their highs earlier in 2015, and the technical charts point to further declines coming this fall, which of course is a historically weak seasonal period for stocks. Numerous technical indicators signal that if the S&P 500 cannot hold support in the 1820-1867 range, a drop all the way to 1680 is the next likely step down. Moreover, in the current period of volatility, stocks and oil are trading together. When one goes down, so does the other. A bearish market trend and linkage of stocks and oil is very, very bad news for the energy stocks in XLE. One chart shows clearly how much more room XLE has to fall: (click to enlarge) This chart shows the ratio of the share price of XLE to the actual price of WTIC oil, over the entire history of XLE as an ETF, from 1999 to the present. Notice how elevated the XLE price remains today, as compared with the oil price. The ratio has retreated from its all-time highs earlier this year, but it still remains very high compared to most of the past decade and a half. If the broader stock market takes another turn for the worse, this charts shows that XLE has plenty of room to fall along with it, even after the oil price itself nears a bottom and stops falling so steeply. Notice in the chart that until last year, the XLE:$WTIC ratio normally stayed in a range from 0.6 to 0.8. With all stocks in a downward trend, there is no particular reason to expect that XLE will stay elevated above that range, and every reason to expect the likelihood of XLE returning to that range. For example, if the oil price settles at $40 and the XLE:WTIC ratio even returns to the top of the old range at 0.8, that would mean an XLE share price of $32, almost a 50% drop from its current price. If the oil price settles at $35 and the ratio falls to the bottom of the old range at 0.6, that would mean an XLE share price of $21, a 66% drop from its current price. I am not predicting that XLE will crash to $21 or even $32 this fall. I am just pointing out that it is well within the realm of reasonable possibility and would not represent an extreme change in the historical performance of XLE relative to the oil price. More likely is a decline to the low $40s or high $30s this fall, the range that XLE fell to in the crash of 2008-2009. The overall stock market would not have to crash 2008-style for XLE energy stocks to fall to those levels. The process will look very different because in 2008, stocks crashed first and then the oil price dropped, whereas this time the oil price dropped first and stocks are falling later. Actions to take: First of all, don’t buy oil stocks yet! The knife is still falling. More aggressive investors can consider shorting XLE. As a hedge, investors can short XLE and buy The United States Oil ETF, LP ( USO) to play a decline in the XLE:$WTIC ratio.
3 Reasons Why Risk Is Exiting The Debate Stage

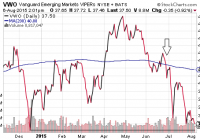
Investors tend to ignore financial markets until they really start to move significantly in one direction or the other. Ironically, investors who wait to buy undervalued securities when the technical backdrop is dramatically improving tend to miss out on sensible risk-taking opportunities. Don’t let the flatness fool you; risk-taking is subsiding and risk-aversion is gaining. More than a handful of people asked me if I would be watching the big debate. 10 candidates. One stage. Which politician will emerge as the clear-cut favorite to win the Republican party nomination? It may surprise some folks, but I have zero interest in the made-for-television event. Each individual will receive about as much air time as Bethe Correia earned in her UFC Title fight against Ronda Rousey. (America’s superstar dropped the Brazilian fighter in 34 seconds.) From my vantage point, a debate exists when two individuals (or two unique groups) express vastly different opinions. And I would be intrigued by an actual match-up with actual position distinctions. Scores of presidential hopefuls from one side of the aisle looking to land a sound byte? I’d rather watch multiple reruns of ESPN’s SportsCenter. In other words, I will tune in when it’s Walker v. Kasich and Hillary versus Joe. (I am name-dropping, not predicting.) In the same way that I might ignore political theater until it really starts to matter, investors tend to ignore financial markets until they really start to matter. And by really start to matter, I mean move significantly in one direction or the other. Ironically, investors who wait to buy undervalued securities when the technical backdrop is dramatically improving tend to miss out on sensible risk-taking opportunities. In the same vein, those who wait to reduce exposure to extremely overvalued stocks when the technical backdrop is weakening tend to miss out on sensible risk-reduction opportunities. What’s more, theoretical buy-n-holders shift to panicky sellers when the emotional pain of severe losses overwhelm them. Although the Dow is slightly negative in 2015, and the S&P 500 is slightly positive, risk has already been sneaking out the back door. Don’t let the flatness fool you; don’t be misled by ‘journalists’ with political agendas. Risk-taking is subsiding and risk-aversion is gaining. Here are three reasons why risk has been exiting the debate stage: 1. The Recovery Is Stalling . Bad news on the economy had been good news throughout the six-and-a-half year stock bull. The reason? The Fed maintained emergency level policies of quantitative easing (i.e., QE1, QE2, Operation Twist, QE3) as well as zero percent overnight lending rates. Today, however, the Fed desperately wants to flip the narrative such that committee members can claim the economy is healthy enough for rate tightening. The data suggest otherwise. For example, Wednesday’s ADP report of 185,000 jobs in July was 20% lower than July of 2014 a year earlier. It is also the lowest headline ADP number since Q1 2014 when an unusually rough winter shouldered the blame. This goes along with the worst wage growth since data have been kept (0.2%), U-6 unemployment between 10.8% ( BLS ) and 14.6% (Gallup), as well as the lowest percentage of employees participating in the working-aged labor pool (62.7%) since 1977. It gets worse. Factory orders have only experienced month-over-month growth in 3 of the last 12 months. Year-over-year, export activity is down 6.6%. Business spending via capital expenditures – dollars used to acquire or upgrade plants, equipment, property and other physical assets – has plummeted. Corporate revenue (sales) will be negative for the second consecutive quarter, perhaps contracting -3.8% in Q2 per FactSet. What’s more, the Conference Board’s Consumer Confidence sub-indexes are dismal; the future expectations gauge is falling at a faster month-over-month clip than the present situation measure. Consumer spending is sinking as well. In sum, risk aversion as well as outright bearish downturns are frequently associated with recessionary pressures. Is a recession imminent? Maybe not. Yet risk-off movement in the financial markets reflect understandable concerns that the U.S. economy may not be capable of absorbing multiple rounds of Federal Reserve tightening. 2. Commodities Are Tanking . One could easily wrap the commodities picture up into discussions about the U.S. economy. That said, I am pulling the topic out into a separate header because it reflects economic woes around the world. As it stands, the IMF’s most recent projections for global output in 2015 represent the slowest annual ‘expansion’ in four years. And the waning use of raw materials is a big part of the IMF’s anemic outlook as well as the collapse in commodity prices. For a year now, a wide variety of analysts have endeavored to explain the oil price decline in positive terms. They’ve been wrong. Consumers and businesses are not spending their energy savings. Meanwhile, energy companies are abandoning projects, laying off high-paying employees and witnessing a dramatic exodus from their stock shares. The Energy Select Sector SPDR ETF (NYSEARCA: XLE ) has depreciated by more than 30% already. Similarly, many of the world’s emerging markets (and some developed markets) depend upon the extraction of materials and natural resources. Granted, the U.S. stock market has been an island unto itself since 2011. However, no market is an island unto itself indefinitely. The Vanguard FTSE Emerging Markets ETF (NYSEARCA: VWO ) is reaching for 52-week lows. The PowerShares DB Commodity Index Tracking ETF (NYSEARCA: DBC ) is already there. And in the last two U.S. recessions, year-over-year commodity depreciation via the Core CRB Commodity Index led forward S&P earnings estimates significantly lower. 3. ‘Technicals’ Are Faltering . Overvalued equities can become even more overvalued, particularly when authorities are easing the rate reins and/or an economy is expanding at a brisk pace. In fact, expensive stocks often become even pricier before market participants typically become squeamish. Yet current technical data show that – across the entire risk spectrum – the smarter money may be seeking safer pastures. What’s more, authorities are talking about tightening at a time when the economy is not expanding briskly. In the bond market, the spread between the Composite Corporate Bond Rate (CCBR) and the 10-year yield is widening. That is a sign of risk aversion. Similarly, investment grade treasuries are witnessing higher highs and higher lows (bullish) whereas the iShares iBoxx $ High Yield Corporate Bond ETF (NYSEARCA: HYG ) has seen lower highs and lower lows (bearish). These developments are also signs of risk leaving the room before the elephant. In equities, more stocks in the S&P 500 are below their long-term moving average (200-day) than above them. This is coming form a place where 85% of the components had been in technical uptrends. Historically speaking, this kind of narrowing in market breadth is typically associated with an eventual stock benchmark correction. Additionally, as I had identified in my commentary one week ago , the New York Stock Exchange Advance Decline Line (A/D) has a strong track record as a leading indicator of corrections/bears. It recently crossed below its 200-day for the first time in four years (as it did prior to the euro-zone crisis in 2011). In addition, decliners have been pressuring and outpacing advancers regularly since the beginning of May. Granted, the Dow Jones Industrials (DJI) Average and the Dow Jones Transportations (DJT) Average may not be as important as the S&P 500 in identifying technical breakdowns. (Dow Theorists would disagree with me on that.) Nevertheless, when the DJI and DJT are both signalling the potential for longer-term downtrends, there’s something going on. What’s going on? Risk is quietly tip-toeing off the stage. I’ve been telling folks for several months to rethink partying like it’s 1999 . Otherwise, you may find that you overstayed your welcome and that the punch bowl is empty. Is it too late to ratchet down the risk? Hardly. When sky-high valuations meet with weakness in market internals, a 65% growth/35% income investor might make a strategic shift toward 50% large-cap and mid-cap equity/30% investment-grade income/20% cash. You’ve reduced equity risk by avoiding small companies; you’ve reduced income risk by exiting higher-yielding junk. And you’ve given yourself the cash that put you in the right frame of mind to be able to “buy lower” in the next correction. Disclosure: Gary Gordon, MS, CFP is the president of Pacific Park Financial, Inc., a Registered Investment Adviser with the SEC. Gary Gordon, Pacific Park Financial, Inc, and/or its clients may hold positions in the ETFs, mutual funds, and/or any investment asset mentioned above. The commentary does not constitute individualized investment advice. The opinions offered herein are not personalized recommendations to buy, sell or hold securities. At times, issuers of exchange-traded products compensate Pacific Park Financial, Inc. or its subsidiaries for advertising at the ETF Expert web site. ETF Expert content is created independently of any advertising relationships.

Why Energy ETFs Are Now A No-No For Wealth-Building Investors

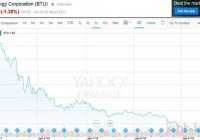
Summary Their prices are all driven by the common denominator of WTI crude prices. Long and Inverse, Leveraged and Unleveraged, all are negatively impacted as crude fights to retain its present share of energy demand. The most telling influence on energy investments, both near term and long term is uncertainty. Near term: Fuel price changes. Longer term: Various fuel shares in energy markets competition. Supply and demand set prices. Surprised? Probably no one is. But is lack of demand the culprit, causing falling prices? Hardly. A revolution in extractive technology has revealed the extent of available, economically attractive natural gas resources, not only in North America, but also worldwide. In comparison to the $4+ prices available in US payoffs up to a year ago for 1 million BTUs of heat generation from reliably available fuel sources, developer-producers in the northeast USA (under financial pressures created in acquiring natural resources) have had to flood the market. The forced surplus over normal demand causes the products to change hands in volume at prices less than half of what used to be. Worse yet, there are reports that major, established NG producers have costs as low as $1.50, and in key areas, sub-$2 prices are the norm. The geology providing this bonanza is not limited to the US. Europe and Asia have identified similar deposits and the extractive technology learning curve is in motion. Coal, which a decade ago was regarded as the USA’s electrical energy backbone, with over 600 years of domestic reserves available, is now facing a virtual complete takeover of its demand market by natural gas. Utilities, prodded by ecological regulations, are converting as fast as they can to get pipeline connections. The stock of Peabody Energy Corporation (NYSE: BTU ), the largest coal supplier, sold above $60 as recently as mid-2011. Now it trades at under $1.20 a share, just 5 years later. (click to enlarge) This is not a transient, irregular, or cyclical phenomenon. It is a major change in the state of energy economics. It is already having major effects in the sources of energy conversion. Before a decade from now passes, it will produce major changes in motive power for personal transportation. It is already impacting commercial hauling. Obama may take credit for a major shift in carbon reductions at electric power plants, but should only get props for being politically agile. Major, established energy producers will have to adapt to the new scene, or become minor players as others in the chain of energy production to consumption become more important. It remains to be seen whether the petroleum industry’s giants, many of whom have been faltering in their efforts to maintain their competitive stature will find a way to utilize the resources at their disposal to acquire new strengths and shuck off major commitments that have high risk quotients for economic disaster. Some, like deep-water offshore development well projects with huge capital commitments cannot dodge return on investment disaster. The major profit source for petroleum producers is gasoline, refined from crude oil, consumed largely in the US by the transportation sector. When crude was priced above $100 a barrel (little more than a year ago) nat gas was quoted at $4.50-$5. Elaborate engineering tests quoted extensively by Wikipedia indicate equivalent miles per gallon operating costs on a wide variety of in-production automobiles to be 2 ½ times as costly for ICE gasoline-consuming vehicles as purely electric-drive vehicles. Annual fuel costs under average operating conditions were shown as $2,300 for popular present-day ICE cars and less than $1,000 for electric models. Since then, crude costs have declined from $100+ to under $50. Gasoline costs have declined less, from $4.50 a gallon to $3.50. Nat gas prices have declined from $5 to $2.30 in major exchanges, but in many areas they are quoted well under $2. To be more specific, with electricity costs declining and electrical utility presence pervasive geographically, fuel economics and environmental concerns will cause widespread auto conversions from internal combustion engines (ICE) with relatively low energy conversion efficiency from high-cost gasoline or diesel fuel to more efficient electrical motor-powered vehicles. Vehicles residentially fueled overnight by electrical power from Utilities using low-cost natural gas economically delivered to their generating stations by pipeline distribution systems from producing areas. Currently average new car purchase prices average $33,000 to $35,000. Most electric car models currently being offered or in development are priced or aimed at less than this, even before governmental promotion discounts of as much as $7,500. The current major inhibition is distance range. Most electric cars are limited to under 100 miles. The attempted marketing quick-fix is hybrid vehicles, basically still an ICE car, but with electric assist, touted as an electric car with an ICE recharging lifeboat when the volts are depleted. As long as a major part of the gullible consuming public will lease the hybrids or long term finance them, the conversion will be slow. But progress in battery development and increasing awareness of the reduced per-mile transportation cost of the bulk of everyday driving will hit the accelerator at some point. Then, fashion will move from the back seat into the driver’s position. At that point, the ICE and gasoline demand are threatened. Could Chevron (NYSE: CVX ) and Exxon Mobil (NYSE: XOM ) become a BTU? Why aren’t energy stocks ready to recover? Big-money investment funds are nibbling at diversified energy ETFs. That is evident in the risk/reward tradeoff signaled by Market-Maker (MM) hedging of volume (block) trades, often involving $1 million or more at a time. Present day markets can’t handle such trades “regular-way” (by automation or high-frequency trading algorithms) so the Market-Makers are called on to provide liquidity. That only happens where they can find a speculator to take on the risk, usually via a hedging deal, done thousands of times a day. Such hedging reveals just how far knowledgeable investors think the involved securities prices might go, both up and down. Figure 1 shows how major Exchange Traded Funds (ETFs) are currently being viewed by players in the game who have the money muscle to move prices. Figure 1 (Used with permission) In this map of upside to downside prospects, lower-right (green) is good, upper-left (red) is bad, and the dotted diagonal is where they balance. Location [8] is the Energy Select Sector SPDR ETF (NYSEARCA: XLE ). Its minimal downside and passable upside suggest prospects for a favorable tradeoff. To check that out, let’s see how the same crowd views each of XLE’s largest holdings. Figure 2 (Source: Yahoo Finance) XLE’s roundup of ten of the usual suspects brings in over 60% of its committed capital. When we put them to the test of what the market-making professionals think their big-$ portfolio-manager clients are likely to do next, Figure 3 tells an interesting story. Figure 3 (click to enlarge) Hedging actions by MMs in block trades on each of the major holdings of XLE and in XLE itself imply the prospective price ranges in columns (2) and (3). (5) is the upside of (2) above (4). (6) tells the typical actual stresses experienced in 3-month holdings following forecasts like today’s, encountered the sample number of times (12) in the past 5 years. (9) shows what the net gains of those experiences were, and (8) tells what proportion of them recovered from the traumas of (6) to bring home a profit. Now, let’s look at these quantities for the average of the ten largest XLE holdings, and compare those averages to what is expected of XLE. The (5) upside is supported, but there seems to be some anti-gravity legerdemain at work on the downside. Maybe it is because the small sample of 1 in (12) for XLE may not be as convincing as the average of 122 experiences for each of the ten holdings. Also, disturbing is the fact that barely half of the holdings were able to dig themselves out of the drawdowns back into a profit (9). Not a very magnificent profit at that, less than 1%, particularly when compared to the +10%+ earned by the 20 currently top-ranked equities in our daily list. There about 7 of every 8 positions was a winner. The implied upside recovery potential of the holdings lacks credibility (13) where (9) actual history of 0.8% is compared to (5) implied profit prospects of +12.2%. Is this all just fantasy, numbers sucked out of the thumb of some analyst? When things don’t fit together well, such concerns may be justified. We need to have some reassurance that this is not some ENRON or LIBOR situation. Figures don’t lie, but … we all know what has happened. I can tell you that there is evidence in the form of double-entry recorded actual exchange transactions in the hedging deals that can’t be faked. In addition, real money has been endangered to transfer risk from one party to another, and the trade initiator in each case has wanted badly enough to get his order filled to say that the cost of the price insurance required is not excessive enough to prevent him from paying it. Consenting adults from 3 directions form a financial menage-a-trois. Real life in the investment world often means someone is wrong and gets … disappointed. Conclusion There is enough rational discontinuity here to encourage serious thinkers to look elsewhere for profitable pursuits. Disclosure: I/we have no positions in any stocks mentioned, and no plans to initiate any positions within the next 72 hours. (More…) I wrote this article myself, and it expresses my own opinions. I am not receiving compensation for it (other than from Seeking Alpha). I have no business relationship with any company whose stock is mentioned in this article.