Tag Archives: early-look

Have Bonds Lost Their Safe Haven Status To Gold?

Summary Price correlations have changed. Bonds no longer trade inversely to stocks. Bonds are no longer the safe haven. Gold is the new market safe haven. Traditionally speaking, bonds and stocks have traded inversely to each other . This is evident if one looks at these charts below. In 2008, the TLT (a bond ETF) went up in value, whereas the Dow crashed. In 2009, the TLT declined in value, whereas the Dow began its new bull market. But in 2011, that traditional correlation changed. In 2011, the bond market started to rise in correlation with the stock market. The bond market didn’t rise in an esclator like fashion such as the stock market, but it did rise in correlation with the stock market. This new correlation can be attributed to foreigners buying US assets , combined with the fact that the Federal Reserve was buying US treasuries, thus suppressing interest rates. Foreigners weren’t just buying US stocks, they have also bought US real estate as well . This form of flight capital and QE, has now made all US assets rise contemporaneously. In 2011, this wasn’t the only correlation that changed, as the two charts below show. As you can see from 2005-07, the price of gold rose in correlation with the stock market. Then in 2008, during the financial crisis, the price of gold declined with the stock market. From 2009-2011, Gold and the Dow, both rose in value. In 2011, however, that correlation changed. Gold started to decline in value, while the stock market keep rising. In my opinion, the one correlation that hasn’t changed, is the one between gold and bonds. Looking at the two charts below, I think they have always traded inversely of each other. From 2005 to 2007, gold rose in value, while the bond market remained relatively flat. During the ’08 crisis, bonds rose almost vertically, while the price of gold declined briefly. After the 08 crisis, the price of gold rose drastically, while the bond market declined. Lastly, in 2011, the bond market started to rise in value, while gold started its decline. Conclusion As stated above, one can see the price correlations have changed, this is likely due to global quantitative easing . If there is another crash, or foreigners loose confidence in the US markets, stocks and bonds will have a high a probability of declining in value at the same time, and unlike previous market panics, gold will be the new safe haven, and not bonds. I am not saying there will be a market crash soon, but if there is, it won’t be bonds that will perform well (like they did in 2008), it will be gold. Disclosure: The author has no positions in any stocks mentioned, and no plans to initiate any positions within the next 72 hours. (More…) The author wrote this article themselves, and it expresses their own opinions. The author is not receiving compensation for it (other than from Seeking Alpha). The author has no business relationship with any company whose stock is mentioned in this article.

Alpha Generation For Active Managers

We are currently seeing a lot of attractive opportunities in the high-yield market. They don’t really seem to reflect the true opportunity we are seeing in the market. This is where active management is especially important. By: Heather Rupp, CFA, Director of Research for Peritus Asset Management, the sub-advisory firm of the AdvisorShares Peritus High Yield ETF (NYSEARCA: HYLD ) As we discussed in our recent blog (see ” The Opportunity in Volatility “), we are currently seeing a lot of attractive opportunities in the high-yield market discounts and yields that we haven’t seen in some time. And while we have seen the yields in the high-yield indexes and the products that track them increase over the last six months, they don’t really seem to reflect the true opportunity we are seeing in the market. For instance, the yield-to-worst on the Barclays High Yield index is 6.46% 1 , and many of the large index-based products are reporting yields around 6%. While this is certainly better than the index yields of sub-5% that we saw in mid-2014, this level at face value isn’t something we’d be really excited about. So then why are we excited about today’s high-yield market and see this as an attractive entry point? Digging into what is held in the index, we see 33% of the issuers in index trade at a yield-to-worst of 5% or under 2 . The large majority of this low-yielding contingency consists of quasi-investment grade bonds, rated Ba1 to Ba3. Not only does this group provide a low starting yield, but would expose investors to more interest rate sensitivity if and when we do eventually see rates rise (given the lower starting yields). On the flip side, 30% of the issuers in that index are trading at a yield-to-worst of 7.5% and above 2 , which in today’s low-yielding environment, with the 5-year Treasury around 1.2%, seems pretty decent. This group is certainly not dominated by the lowest rated of names, and within this group, we are seeing an eclectic mix of businesses and industries. Yes, there are segments of this group that we are not interested in. For instance, we have been outspoken on our concerns for many of the domestic shale producers in the energy space, given that we saw these as unsustainable business models when oil was near $100, and those issues will certainly be acerbated with oil at $50 as cash to mitigate the rapid well decline rates and to service heavy debt loads quickly runs out. But there are also what we see as great mix of business and industries that we would be interested in committing money to, especially at these levels. This is where active management is especially important. We view active management as about managing risk and finding value. Yes, it is about managing credit risk (determining the underlying credit fundamentals and prospects of each investment you make – basically doing the fundamental analysis to justify an investment in a given security) and managing call risk (paying attention to the price you are paying for a security relative to the next call price to address the issue of negative convexity), as we have written about at length before. Yet, one risk factor that is often overlooked is that of purchase price. By this, we mean buying at an attractive price. While it isn’t very intuitive, because it often seems that the risk is less when markets are on a roll and moving up, but really the lower the price you pay for a security, the lower the risk (you have less to lose because you put less in up front). Jumping in on the popular trade certainly doesn’t reduce your risk profile. Rather, you want to purchase a security for a price less than you think it is worth. As we look at much of the secondary high-yield market, especially many of the B and CCC names that have been out of favor over the past several months, we are seeing a more attractive buy-in for selective, active managers, which we believe lowers our risk. And there remains a segment of “high yield” that isn’t at prices or yields that we would consider attractive, and we will avoid investments in those securities. Alpha generation involves buying what we see as undervalued securities with the goal of generating excess yield and/or potential capital gains. Today, we are seeing this opportunity for potential alpha generation for active managers. 1 Barclays Capital US High Yield Index yield to worst as of 1/30/15. Formerly the Lehman Brothers US High Yield Index, this is an unmanaged index considered representative of the universe of US fixed rate, non-investment grade debt. 2 Based on our analysis of the Barclays Capital High Yield index constituents as of 1/30/15. Disclosure: The author has no positions in any stocks mentioned, and no plans to initiate any positions within the next 72 hours. (More…) Business relationship disclosure: AdvisorShares is an SEC registered RIA, which advises to actively managed exchange traded funds (Active ETFs). This article was written by Heather Rupp, CFA, Director of Research of Peritus, the portfolio manager of the AdvisorShares Peritus High Yield ETF (HYLD). We did not receive compensation for this article, and we have no business relationship with any company whose stock is mentioned in this article. This information should not be taken as a solicitation to buy or sell any securities, including AdvisorShares Active ETFs, this information is provided for educational purposes only. Additional disclosure: To the extent that this content includes references to securities, those references do not constitute an offer or solicitation to buy, sell or hold such security. AdvisorShares is a sponsor of actively managed exchange-traded funds (ETFs) and holds positions in all of its ETFs. This document should not be considered investment advice and the information contain within should not be relied upon in assessing whether or not to invest in any products mentioned. Investment in securities carries a high degree of risk which may result in investors losing all of their invested capital. Please keep in mind that a company’s past financial performance, including the performance of its share price, does not guarantee future results. To learn more about the risks with actively managed ETFs visit our website AdvisorShares.com .

It’s Time To Get Long Volatility

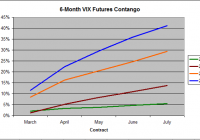
Contango-associated rollover losses have traditionally made holding volatility ETFs for more than a few weeks a dangerous proposition. Over the last two months, however, the VIX futures strip on which volatility ETFs are based has flattened reducing the expense of holding funds such as VXX and TVIX. There is an inverse relationship between VIX price and magnitude of contango. A VIX Risk/Reward score can be used to pinpoint ideal entrypoints for a buy-and-hold position in volatility ETFs. With a current value I have written multiple articles over the past 6 months- Here , Here , and Here -advocating shorting volatility ETFs to take advantage of monthly rollover losses. Recent develops in the VIX Futures market on which volatility ETFs are based, however, has made the sector more attractive as a longer term buy-and-hold position. Anybody who has traded volatility ETFs over the past five years knows that there is a constant uphill battle against the forces of contango. Volatility spikes can generate tremendous short-term gains in these ETFs, but the funds tend to underperform dramatically while awaiting these surges in volatility. While the volatility ETFs are traditionally associated with the VIX-the S&P 500 volatility index-the funds actually hold near-term VIX futures contracts. These contracts expire on a monthly basis and the fund must sell all of its front month contracts and role those funds over into the next month’s contract prior to expiration. Since the market bottom in March of 2009, these later month VIX futures contracts have been persistently more expensive than the front-month, expiring contract, a situation known as contango. This is not that surprising as volatility has been historically low as the markets have rallied these past five years keeping near term volatility low while the prospect of a future market correction has forced investors to pay premiums for later contracts. Unfortunately, this phenomenon has been devastating to short term volatility ETFs such as the iPath S&P 500 VIX Short-Term Futures ETN (NYSEARCA: VXX ) and the leveraged VelocityShares Daily 2x VIX Short-Term ETN (NASDAQ: TVIX ). Each time a fund roles over to a new contract that is in contango, it can buy fewer shares than it just sold, and over time, this results in a significant underperformance of the ETF versus the futures market on which it is based. In 2013, for example, the VIX front month futures lost 10.6% as volatility continued its decline while VXX was down a massive 62%. The 2x leveraged ETF TVIX fared even worse, down 89.8% versus a predicted loss of 21.2%. It is for this reason that I argued for shorting VXX and actively avoiding TVIX as a long term investment in previous articles. Over the past month or two, however, the VIX Futures pattern has evolved to one that I believe to be much more favorable to longer-term traders. Figure 1 below shows the % premium of each contract in the six-month VIX Futures Strip for February 2015 through July compared to the same period in 2014, 2013, and 2012. (click to enlarge) Figure 1: 6-Month Contango 2012-2015 (Source: Yahoo Finance Historical Quotes) It is clear that there has been a flattening of the VIX futures curve in 2015 versus previous years meaning that rollover losses will be limited for volatility ETFs. As of Friday’s close, holding VXX for the next sixth months would result in just a 5.5% rollover-associated loss, assuming no change to the Futures Strip. This compares to a 14% projected loss during the same period in 2014, 29% in 2013 and a disastrous 41% in 2012. Holders of the leveraged ETF TVIX can expect these losses to be doubled. However, this only tells half of the story. There is an inverse relationship between VIX future price and contango. Figure 2 below shows a scatterplot of front-month VIX price against 6-month contango using data for the past five years. As the price of the front-month VIX contract increases, the level of contango tends to decrease. In fact, once the VIX futures reach a certain level-somewhere above 20–the contacts tend slip into backwardation, the opposite of contango in which rollovers actually benefit the longs. (click to enlarge) Figure 2: Over the last 5+ Years, as VIX Futures Price decreases, Contango tends to increase (Source: Yahoo Finance Historical Quotes) At the same time, however, higher VIX levels have a much higher probability to mean revert to the average VIX level, which, over the last 5-years is somewhere around 18, as the market rallies. Figure 3 below shows the average peak six-month return based on the front-month VIX futures contract based on initial VIX starting price. (click to enlarge) Figure 3: Average Peak 6-month return by VIX range (Source: Yahoo Finance Historical Quotes) When the VIX price is less than 12, the average peak six-month return is over 100%, which stabilizes at around 35% between 14 and 20, and then slows to less than 8% when the front month VIX futures is above 30. What is needed, therefore, is a balance between a low VIX entry price while maintaining as minimal level of contango as possible. Sure, a cheap VIX may mean the possibility of a large return on a VIX spike, but you will pay for it through steep rollover losses awaiting for that singular moment. On the other hand, an elevated VIX means that rollover losses will be minimal and it will be cheap to hold the ETF for an extended period of time, but the probability of profiting from a spiking VIX will be much more limited. Overlaying the data from Figures 2-representing the expense curve-and Figure 3-representing the returns curve-produces the chart shown below in Figure 4. This graph implies that at VIX futures prices when the returns curve is greater than the expenses curve, the risk-reward profile is in favor of the longer term holder (that is, out to six-months). However, once the curves intersect at around 22, projected expenses equal projected returns and a buy-and-hold trade is no longer worthwhile. (click to enlarge) Figure 4: Historical projected 6-month return and expenses by VIX range (Source: Yahoo Finance Historical Quotes) This is a good theoretical exercise, but relies on historical averages. What does the current picture look like? A cheap VIX/low contango metric can be calculated simply by multiplying the absolute value of the contango (or backwardation) by the current front month VIX futures contract price. The lower that this number is, the greater the potential for profit while limiting rollover losses. Figure 5 below shows this VIX Risk/Reward Score over the past five years. (click to enlarge) Figure 5: VIX Risk/Reward Score Over the past 5+ years where lower values suggest favorable buying opportunities (Source: Yahoo Finance Historical Quotes) As of Friday’s closing front-month VIX Futures price of $19.18 with a six-month contango of 5.5%, the VIX Risk/Reward Score is 1.05 which, as figure 5 illustrates, is well below the 5-year average of 3.78, indicating a good risk/reward for going long volatility. Indeed, Friday’s close is in the 92nd percentile indicating a historically low score. This effectively allows us to take the projected VIX Expenses curve in Figure 4, which shows an historical average of about a 25% 6-month contango-associated loss at current levels, and shift it downward to match the current 5% projected loss. The proof, as they say, is in the pudding. The VIX risk/reward score has been