Tag Archives: transactionname

Today’s Best-Bet Wealth-Builder ETF Investment

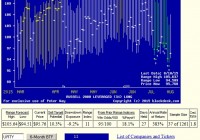
Summary From a population of some 350 actively-traded, substantial, and growing ETFs this is a currently attractive addition to a portfolio whose principal objective is wealth accumulation by active investing. We daily evaluate future near-term price gain prospects for quality, market-seasoned ETFs, based on the expectations of market-makers [MMs], drawing on their insights from client order-flows. The analysis of our subject ETF’s price prospects is reinforced by parallel MM forecasts for each of the ETF’s ten largest holdings. Qualitative appraisals of the forecasts are derived from how well the MMs have foreseen subsequent price behaviors following prior forecasts similar to today’s. Size of prospective gains, odds of winning transactions, worst-case price drawdowns, and marketability measures are all taken into account. Today’s most attractive ETF Is the ProShares UltraPro Russell2000 ETF (NYSEARCA: URTY ). The investment seeks daily investment results that correspond to three times (3x) the daily performance of the Russell 2000® Index. The fund invests in securities and derivatives that ProShare Advisors believes, in combination, should have similar daily return characteristics as three times (3x) the daily return of the index. The index is a float-adjusted, market capitalization-weighted index containing approximately 2000 of the smallest companies in the Russell 3000® Index or approximately 8% of the total market capitalization of the Russell 3000® Index, which in turn represents approximately 98% of the investable U.S. equity market. It is non-diversified. The fund currently holds assets of $79.94 million and has had a YTD price return of +6.57%. Its average daily trading volume of 140,328 produces a complete asset turnover calculation in 5.9 days at its current price of $95.76. Behavioral analysis of market-maker hedging actions while providing market liquidity for volume block trades in the ETF by interested major investment funds has produced the recent past (6 month) daily history of implied price range forecasts pictured in Figure 1. Figure 1 (used with permission) The vertical lines of Figure 1 are a visual history of forward-looking expectations of coming prices for the subject ETF. They are NOT a backward-in-time look at actual daily price ranges, but the heavy dot in each range is the ending market quote of the day the forecast was made. What is important in the picture is the balance of upside prospects in comparison to downside concerns. That ratio is expressed in the Range Index [RI], whose number tells what percentage of the whole forecast range lies below the then current price. Today’s Range Index is used to evaluate how well prior forecasts of similar RIs for this ETF have previously worked out. The size of that historic sample is given near the right-hand end of the data line below the picture. The small blue thumbnail distribution at the bottom of Figure 1 indicates the current RI’s size in relation to all available RIs of the past 5 years. The first items in the data line are current information: The current high and low of the forecast range, and the percent change from the market quote to the top of the range, as a sell target. The Range Index is of the current forecast. Other items of data are all derived from the history of prior forecasts. They stem from applying a T ime- E fficient R isk M anagement D iscipline to hypothetical holdings initiated by the MM forecasts. That discipline requires a next-day closing price cost position be held no longer than 63 market days (3 months) unless first encountered by a market close equal to or above the sell target. The net payoffs are the cumulative average simple percent gains of all such forecast positions, including losses. Days held are average market rather than calendar days held in the sample positions. Drawdown exposure indicates the typical worst-case price experience during those holding periods. Win odds tells what percentage proportion of the sample recovered from the drawdowns to produce a gain. The cred(ibility) ratio compares the sell target prospect with the historic net payoff experiences. Figure 2 provides a longer-time perspective by drawing a once-a week look from the Figure 1 source forecasts, back over two years. Figure 2 (used with permission) What does this ETF hold, causing such price expectations? Figure 3 is a table of securities held by the subject ETF, indicating its concentration in the top ten largest holdings, and their percentage of the ETF’s total value. Figure 3 source: Yahoo Finance URTY holdings reveal how an average of assets in each of its top ten commitments, all swap contracts in either the Russell 2000 index or the ETF tracking that index, iShares Russell 2000 (NYSEARCA: IWM ) provide a 3x leverage to the price movements of that small-cap index. Please note that the top ten swap contracts equal 278% of the ETF’s total assets. To have an idea of the composition of the Russell 2000 index, Figure 4 is a table of data lines similar to that contained in Figure 3, for each of the top ten holdings of the ETF tracking the Russell 2000 index, IWM. Figure 4 source: Yahoo Finance Now note that the Russell 2000 index does indeed contain 2,000 securities of small-capitalization companies, many of which are in quite volatile circumstances. The IWM’s top ten holdings (by size of holding) quite probably are intended to be the better-performing issues. While these ten represent only 2 ½% of the fund’s total assets, they are five times the size of ten average pieces of 2,000 securities at 0.05% of the total. The IWM’s top ten holdings provide only a peek at the kinds of companies contained in the Russell 2000 index, but it is better than nothing (or of everything). In order to fill out some sense of these emphasized holdings of the fund and the index, Figure 5 gives the details of MM price range hedging-derived forecasts for each of the ten, and compares them with data from our ranked top20 securities list for the same day. Figure 5 (click to enlarge) In an index as unpredictably dynamic as this, wide variations in market experience seem to be the rule. Column (5) contains the upside price change forecasts between current market prices and the upper limit of prices regarded by MMs as being worth paying for price change protection. The average of +12.7% of the top ten IWM/index holdings is close to our list’s population average of all 2500+ equities MM forecasts of +13.1%. It is about 2 ½ times the upside forecast for SPY price change prospects. The other side of the coin is column (6), which shows what actual worst-case price drawdowns typically have been in the 3 months following each time there has been a forecast like those of the present day. Those risk exposures have averaged -6.3% in the holdings top ten, better than -8.6% experienced by list equities at large, but larger than the only -3.3% on the SPY ETF. These holdings have attractive reward tradeoffs between returns and risks, with the top ten (column 14) at a ratio of 2.0, compared to equities overall at 1.5 times. This is better than the market average of SPY at a ratio of 1.7 times risk avoidance, which has a cost of an anticipated reward (column 5) only half that of the ten best index stocks. Another qualitative consideration is the credibility of the ten IWM/index big holdings after previous forecasts like today’s. The net average price change (column 13) of the ten has been 0.8 times the size of the (column 5) upside forecast average, +10.6% (column 9) compared to +12.7%. The equity population’s actual price gain achievement, net of losses has been a pitiful +3.7% compared to promises of 13.1%. The ability of IWM/index holdings to recover from those worst-case drawdowns and achieve profits occurred in 83% of experiences (column 8). The equity population only recovered less than two thirds of the time, and while the SPY experiences were about the same as the ten IWM/index holdings, the achieved gains were much smaller. SPY has had only +3.4% gains previously from like forecasts of +5.7%. In many respects the IWM/index holdings are quite similar to the average of our daily best20 list. That should be no surprise, since URTY is one of those 20 best ranked issues on this day. Conclusion URTY provides attractive forecast price gains, supported by its equally appealing largest holdings. Both the ETF and many of its major holdings offer very attractive prospects in near-term price behaviors, demonstrated by previous experiences following prior similar forecasts by market makers. The diversity of its holdings is very broad, providing a wide opportunity to share in constantly developing discoveries across the biotechnology as well as software applications and other high-technology fields. URTY’s price now, in comparison to the forecast price expectations of market professionals, appears to be quite attractive. Disclosure: I/we have no positions in any stocks mentioned, and no plans to initiate any positions within the next 72 hours. (More…) I wrote this article myself, and it expresses my own opinions. I am not receiving compensation for it (other than from Seeking Alpha). I have no business relationship with any company whose stock is mentioned in this article.
Vanguard 500 Index Fund: A Mutual Fund Anyone Can Appreciate In Their 401k

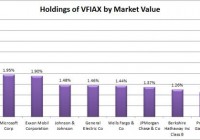
Summary VFIAX is a mutual fund designed to track the S&P 500 with a lower expense ratio than SPY. The mutual fund is a great holding for investors wanting to replicate the performance of “the market” without getting devoured by fees. This is a solid option for the retirement account. The Vanguard 500 Index Fund Admiral Shares (MUTF: VFIAX ) offer investors an excellent way to handle their investments. While I’m a huge fan of using ETFs in the construction of a portfolio, Vanguard is offering some mutual funds with very compelling expense ratios. The nice thing about these mutual funds is that investors are able to buy fractional shares which are excellent for dollar cost averaging. Volatility The standard deviation of returns (monthly) shows very similar levels of volatility to the S&P 500 index as tracked by (NYSEARCA: SPY ). Correlation is also running around 99.9%. The holdings are very similar, but these shares are offering a lower expense ratio and the ability to use dollar cost averaging very effectively. Expense Ratio The mutual fund is posting .05% for an expense ratio. There is really nothing to complain about here. It beats SPY and it beats most mutual funds and ETFs in existence. Largest Holdings The diversification within the fund is good. There are not as many holdings as the whole market index funds that I often prefer, but all around this is a very solid fund. (click to enlarge) Risk Factors The biggest issue for VFIAX is the risk that the S&P 500 is getting fairly expensive on many fundamental levels. For instance, the P/E ratio on the index is fairly high (running over 20). The high P/E ratio comes at a time when corporate profits after taxes are also very high relative to GDP. My concern is about the valuation level of the market. When it comes to ways to buy the market, VFIAX is one of the best funds to use for the task. When it comes to risk assessment, I’m not sure I’d go with Vanguard’s scale, shown below: Vanguard has a tendency to mark any primarily equity investment as being fairly high risk. Relative to other equity investments, the risk level here is very reasonable. The fund still scores high on risk for Vanguard’s scale because they are comparing it to other funds stuffed with lower risk securities than equity. Compared to a very short term high credit quality bond fund, I have to agree that VFIAX has substantially more risk. Compared to the broad universe of equity investments, VFIAX is doing a solid job of holding a diversified portfolio of large capitalization companies with solid histories. Other Things to Know Minimum investments for opening a position were $10,000 according to the Vanguard website. After that additional purchases could be in increments as small as $1. This is a solid fund for dollar cost averaging. Based on my macroeconomic views, I would want to use a fund like VFIAX for equity exposure but I also believing hold some cash on hand is wise given the potential for a reduction in equity prices. When it comes to using mutual funds, I think the best way to deal with them is to dollar cost average in. I like using ETFs to adjust my portfolio exposure but the mutual funds can be set as a “set it and forget it” investment vehicle. When making a meaningful contribution to a fund month after month without checking up on it, it would be wise to make sure the fund is reasonably diversified and that the expense ratios are low. The Vanguard 500 Index Fund Admiral Shares easily sail through both of those tests. Conclusion While I am concerned that market valuations are a little on the high side, I’m still investing each month. I choose to hold more in cash than I would if the market looked cheaper, but I still see dollar cost averaging into the right funds as a viable long term strategy. The biggest challenge for investors is to resist the urge to pull back when the market falls. We should all expect that the stock market will fall within the next 30 years. When those drops happen, investors need to be able to stomach stepping into the market to buy. Since those times are often very scary, one solution is to set up automatic purchases for a fund like VFIAX. To avoid overthinking things, I keep automatic contributions running as a baseline for investing. I use my other accounts to make additional purchases. If your employer sponsored plan offers VFIAX, it is a mutual fund worthy of consideration. Figure out your own risk tolerance and determine if the equity exposure is right for you. The biggest potential mistake an investor could make with buying VFIAX would be to put 75%+ of their portfolio in the fund when they are only a couple years from retirement and will be required to sell off shares to take distributions. So long as the total level of risk is appropriate for the investors, this is a great fund to use as the core of a passive retirement portfolio. Disclosure: I/we have no positions in any stocks mentioned, and no plans to initiate any positions within the next 72 hours. (More…) I wrote this article myself, and it expresses my own opinions. I am not receiving compensation for it (other than from Seeking Alpha). I have no business relationship with any company whose stock is mentioned in this article. Additional disclosure: Information in this article represents the opinion of the analyst. All statements are represented as opinions, rather than facts, and should not be construed as advice to buy or sell a security. Ratings of “outperform” and “underperform” reflect the analyst’s estimation of a divergence between the market value for a security and the price that would be appropriate given the potential for risks and returns relative to other securities. The analyst does not know your particular objectives for returns or constraints upon investing. All investors are encouraged to do their own research before making any investment decision. Information is regularly obtained from Yahoo Finance, Google Finance, and SEC Database. If Yahoo, Google, or the SEC database contained faulty or old information it could be incorporated into my analysis.

Playing The Field With Your Investments

For some, casually dating can be fun and exciting. The same goes for trading and speculating – the freedom to make free-wheeling, non-committal purchases can be exhilarating. Unfortunately the costs (fiscally and emotionally) of short-term dating/investing often outweigh the benefits. Fortunately, in the investment world, you can get to know an investment pretty well through fundamental research that is widely available (e.g., 10Ks, 10Qs, press releases, analyst days, quarterly conference calls, management interviews, trade rags, research reports). Unlike dating, researching stocks can be very cheap, and you do not need to worry about being rejected. Dating is important early in adulthood because we make many mistakes choosing whom we date, but in the process we learn from our misjudgments and discover the important qualities we value in relationships. The same goes for stocks. Nothing beats experience, and in my long investment career, I can honestly say I’ve dated/traded a lot of pigs and gained valuable lessons that have improved my investing capabilities. Now, however, I don’t just casually date my investments – I factor in a rigorous, disciplined process that requires a serious commitment. I no longer enter positions lightly. One of my investment heroes, Peter Lynch, appropriately stated, “In stocks as in romance, ease of divorce is not a sound basis for commitment. If you’ve chosen wisely to begin with, you won’t want a divorce.” Charles Ellis shared these thoughts on relationships with mutual funds: “If you invest in mutual funds and make mutual funds investment changes in less than 10 years…you’re really just ‘dating.’ Investing in mutual funds should be marital – for richer, for poorer, and so on; mutual fund decisions should be entered into soberly and advisedly and for the truly long term.” No relationship comes without wild swings, and stocks are no different. If you want to survive the volatile ups and downs of a relationship (or stock ownership), you better do your homework before blindly jumping into bed. The consequences can be punishing. Buy and Hold is Dead…Unless Stocks Go Up If you are serious about your investments, I believe you must be mentally willing to commit to a relationship with your stock, not for a day, not for a week, or not for a month, but rather for years. Now, I know this is blasphemy in the age when “buy-and-hold” investing is considered dead, but I refute that basic premise whole-heartedly…with a few caveats. Sure, buy-and-hold is a stupid strategy when stocks do nothing for a decade – like they have done in the 2000s, but buying and holding was an absolutely brilliant strategy in the 1980s and 1990s. Moreover, even in the miserable 2000s, there have been many buy-and-hold investments that have made owners a fortune (see Questioning Buy & Hold ). So, the moral of the story for me is “buy-and-hold” is good for stocks that go up in price, and bad for stocks that go flat or down in price. Wow, how deeply profound! To measure my personal commitment to an investment prospect, a bachelorette investment I am courting must pass another test…a test from another one of my investment idols, Phil Fisher, called the three-year rule. This is what the late Mr. Fisher had to say about this topic: “While I realized thoroughly that if I were to make the kinds of profits that are made possible by [my] process … it was vital that I have some sort of quantitative check… With this in mind, I established what I called my three-year rule.” Fisher adds, “I have repeated again and again to my clients that when I purchase something for them, not to judge the results in a matter of a month or a year, but allow me a three-year period.” Certainly, there will be situations where an investment thesis is wrong, valuation explodes, or there are superior investment opportunities that will trigger a sale before the three-year minimum expires. Nonetheless, I follow Fisher’s rule in principle in hopes of setting the bar high enough to only let the best ideas into both my client and personal portfolios. As I have written in the past, there are always reasons of why you should not invest for the long term and instead sell your position, such as: 1) new competition; 2) cost pressures; 3) slowing growth; 4) management change; 5) valuation; 6) change in industry regulation; 7) slowing economy; 8) loss of market share; 9) product obsolescence; 10) etc, etc, etc. You get the idea. Don Hays summed it up best: “Long term is not a popular time-horizon for today’s hedge fund short-term mentality. Every wiggle is interpreted as a new secular trend.” Peter Lynch shares similar sympathies when it comes to noise in the marketplace: “Whatever method you use to pick stocks or stock mutual funds, your ultimate success or failure will depend on your ability to ignore the worries of the world long enough to allow your investments to succeed.” Every once in a while there is validity to some of the concerns, but more often than not, the scare campaigns are merely Chicken Little calling for the world to come to an end. Patience is a Virtue In the instant gratification society we live in, patience is difficult to come by, and for many people ignoring the constant chatter of fear is challenging. Pundits spend every waking hour trying to explain each blip in the market, but in the short run, prices often move up or down irrespective of the daily headlines. Explaining this randomness, Peter Lynch said the following: “Often, there is no correlation between the success of a company’s operations and the success of its stock over a few months or even a few years. In the long term, there is a 100% correlation between the success of a company and the success of its stock. It pays to be patient, and to own successful companies.” Long-term investing, like long-term relationships, is not a new concept. Investment time horizons have been shortening for decades, so talking about the long-term is generally considered heresy. Rather than casually date a stock position, perhaps you should commit to a long-term relationship and divorce your field-playing habits. Now that sounds like a sweet kiss of success. Disclosure: Sidoxia Capital Management (SCM) and some of its clients hold positions in certain exchange traded funds (ETFs), but at the time of publishing, SCM had no direct position in any other security referenced in this article. No information accessed through the Investing Caffeine (IC) website constitutes investment, financial, legal, tax or other advice nor is to be relied on in making an investment or other decision. Please read disclosure language on IC Contact page .