Tag Archives: etf-hub-raquo

Fund Investors Look For Comfort In Bond Funds

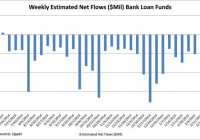
By Tom Roseen Despite U.S. stocks pushing to record highs for the first time in 2015 during the flows week ended February 18, investors continued to pad the coffers of fixed income funds. At the end of the week the minutes of the Federal Reserve’s latest policy meeting indicated officials were not in any hurry to raise interest rates, with many Fed members opining that a premature hike in rates could harm the economy. And, while the stock market showed a muted reaction to the minutes, the benchmark ten-year Treasury yield declined 6 basis points to close the flows week down to 2.07%-but still considerably higher than the lows seen at the beginning of February. During the flows week fund investors injected net new money into three of Lipper’s four broad-based fund macro-groups (including conventional funds and exchange-traded funds [ETFs]). Bond funds (+$5.9 billion) took in the largest haul, followed by equity funds (+$3.7 billion) and municipal bond funds (+$0.1 billion), while money market funds handed back some $14.1 billion-for their largest weekly net redemption since the week ended October 17, 2014. (click to enlarge) Source: Lipper, a Thomson Reuters company For the seventh consecutive week corporate investment-grade debt funds attracted the largest sum of net new money of the fixed income macro-group, taking in a net $3.0 billion for the week, while corporate high-yield funds took in some $1.6 billion-for their fourth week of net inflows in a row. Despite investors’ embracing the thought that the Fed will not be raising interest rates anytime soon, a subset of the corporate investment-grade debt funds group – bank loan funds – witnessed net inflows (+$130 million) for the first week in thirty-two. Share this article with a colleague

The New Enhanced Bond Rotation Strategy With Adaptive Bond Allocation

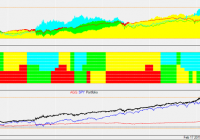
Summary A top 2 ETF (out of 4) bond rotation strategy with adaptive allocation. Switching between treasury bonds and corporate bonds depending to market conditions. Built to perform also in a rising rate environment. On November 2013 I published the first SA article on the BRS ( Bond Rotation Strategy ). Now, 15 months later, I am presenting an important update for this strategy. Even though the old strategy has done well, I think it is very important to constantly validate and improve any investment strategy. Markets change, ETFs change and even we ourselves grow and learn how to increase the returns and limit the risk of our own investments. In November 2014 I presented the Universal Investment Strategy which was based on a variable allocation of the SPDR S&P 500 Trust ETF ( SPY)- iShares 20+ Year Treasury Bond ETF (NYSEARCA: TLT ) funds. This new concept of an ETF rotation with variable allocation is very versatile and can be used on all types of strategies. For the BRS strategy, this new way to calculate allocations results in a considerably improved Sharpe (Return/Risk) ratio of the strategy. Here is the ETF selection for the BRS Old ETF selection New ETF selection SPDR Barclays Capital Convertible Bond ETF (NYSEARCA: CWB ) CWB SPDR Barclays Capital High Yield Bond ETF (NYSEARCA: JNK ) JNK iShares 10-20 Year Treasury Bond ETF (NYSEARCA: TLH ) TLT PowerShares Emerging Markets Sovereign Debt Portfolio ETF (NYSEARCA: PCY ) iShares Core Total U.S. Bond Market ETF (NYSEARCA: AGG ) not necessary anymore PIMCO Total Return ETF (NYSEARCA: BOND ) not necessary anymore iShares 1-3 Year Treasury Bond ETF (NYSEARCA: SHY ) not necessary anymore. The total allocation can go automatically below 100% An advantage of the adaptive allocation is, that we can work with less ETFs. We do not need the total return ETFs and anymore. The old BRS used these ETFs to achieve a blended way of investing in treasuries and corporate bond ETFs. This was needed because normal switching strategies don’t take into account cross-correlation between ETFs. I had to add total return ETFs so that the strategy ‘knew’ about the possible Sharpe ratio of a blended ETF. The new strategy, however, does calculate cross correlations and it will allocate automatically to the top ETFs, so that the Sharpe ratio is maximized. Cross correlation of ETFs is extremely important. If for example the stock market is doing well, then a normal ranking ETF strategy would probably invest in the two highly correlated corporate bonds: and. However a combination of with a negatively correlated treasury would probably have the better Sharpe ratio because of the inverse correlation of the two ETFs. This would reduce volatility and this would result in a higher Sharpe ratio for this ETF pair. For the selection of the 4 ETFs, it was very important to have uncorrelated bonds, so that we would have a successful ETF combinations for any kind of market. ETF Average correlation to the stock market CWB 0.8 JNK 0.7 PCY 0.25 TLT -0.5 (-0.75 during market corrections) PCY is an interesting addition with low correlation to the other ETFs. From a correlation point of view, it sits half-way between stocks and treasuries, and it gives the strategy some additional global diversification. To calculate the strategy we use our QuantTrader software. As this is a top 2 ETF strategy, the algorithm calculates the maximum Sharpe allocation for all 6 possible ETF pairs. We could run allocations from 0% to 100% for each ETF, but for the bond rotation it is better to limit the allocations from a 40% minimum allocation to a maximum of 60%. If we allow bigger variations the risk increases because there would be times where we are invested up to 100% in one single ETF. The return would also increase, but the Sharpe ratio would be lower than with this 40%-60% allocation. One way to further improve risk adjusted returns would be to always invest in all 4 ETFs with adaptive allocation. The algorithm would loop through all allocations like 10%-30%-20%-40% and calculate the max. Sharpe allocation considering the cross correlation of all 4 ETFs. For bigger investments, this would be the best solution with the highest Sharpe ratio and a very low volatility of only 5%. It is also good because the ETF risk is spread among 4 ETFs rather than 2 ETFs. However for the private investor an investment in the best 2 ETFs is absolutely sufficient. The new BRS strategy shares the same tweaked Sharpe formula with the UIS strategy. Normally the Sharpe ratio is calculated by Sharpe=rd/sd with rd=mean daily return and sd= standard deviation of daily returns . I don’t use the risk free rate, as I only use the Sharpe ratio to do the ranking. My algorithm uses the modified Sharpe formula Sharpe=rd/(sd^f) with f=volatility factor . The f factor allows me to change the importance of volatility. If f=0 , then sd^0=1 and the ranking algorithm will choose the composition with the highest performance without considering volatility. If f=1 , then I have the normal Sharpe formula. Using values of f> 1 , I rather want to find ETF combinations with low volatility. With high f values, the algorithm becomes a “minimum variance” or “minimum volatility” algorithm. Here is a comparison between different ways to execute the BRS Comparison of different BRS strategies (5 year) Strategy 5 year CAGR Sharpe ratio Max drawdown 1 Old BRS strategy (top 1 ETFs) 11% annual return 1.13 -12.2% 2 Old BRS strategy (top 2 ETFs) 12.5% annual return 1.44 -9.3% 3 New BRS strategy (2 ETFs) 17% annual return 2.25 -6.5% 4 New BRS strategy (4 ETFs) 13% annual return 2.45 -6.6% 5 benchmark: AGG 4.18% annual return 1.25 -5.1% 6 benchmark: SPY 15.9% annual return 1.01 -18.6% N.B. – no 3 is the strategy used by Logical-Invest The max. drawdown coincides with the end of QE announcement in 2013. Bond strategy drawdowns are mostly driven by FED announcements, but they are about 3x smaller than drawdowns. Here is a screenshot of the 5 year backtest of the new BRS with QuantTrader (click to enlarge) The middle graph shows the allocation of the ETFs and the lower graph shows the strategy compared to two benchmarks: AGG and SPY. Due to the limited history of CWB, which exists only since 2009, this backtest is quite short. However, using mutual fund proxies we can backtest the strategy using a longer historical period. There is a plenitude of different proxies using mutual funds, but none is a 100% match. In particular, emerging market bonds are only available in recent times. Still they add unique diversity. Long term backtests are interesting, but personally I don’t think that you need to look back longer than 10 years. Markets and ETFs evolve so quickly that history that extends back for more than 5 years, is not really useful in fine-tune a strategy which has to successfully trade in current market conditions and whose only goal is to predict the next 20 trading days. So take the results below with a grain of salt. They show that the fundamental principle of the strategy works even before 2008. It does perform even better after 2008 due to increased momentum of stock and bond markets after the 2008 correction. The most important lesson learned from this longer term backtest is that you don’t need to be afraid of big market corrections. Such corrections are even good for strategies with variable allocation, because you can make double the gains. Once using defensive Treasuries during the down going market and then a second time when the markets go up again. Mutual fund proxies used for the longer term backtest ETF Proxy TLT Vanguard Long-Term Treasury Fund Inv (MUTF: VUSTX ) JNK T. Rowe Price High-Yield Fund (MUTF: PRHYX ) PCY T. Rowe Price International Bond Fund (MUTF: RPIBX ) CWB Vanguard Convertible Securities Fund Inv (MUTF: VCVSX ) Benchmark: AGG Benchmark: Vanguard Total Bond Market Index Fund Inv (MUTF: VBMFX ) Here is a screenshot of the 13 year backtest of the mutual fund BRS with QuantTrader (click to enlarge) The charts show that the strategy worked well since 2002. CAGR is 13.2% and Sharpe is 2.02. The max. drawdown was 12.5% in 2008. However one last important question for the future is how the strategy will handle rising rates? I think that the BRS should still do quite well in a rising rate environment, because of the two corporate bonds funds, CWB and JNK. Long duration 15-18 year Treasury bonds and TLT will be affected most by rising rates. But even here I would set a question mark. With Treasury yields near zero in Europe, these U.S. long term bonds are still extremely attractive. Convertible corporate bonds or high yield bonds with short duration and a high coupon are even more attractive and should do quite well in a rising rate environment. Emerging-markets bonds like are quite susceptible to global sentiment, but they should be less affected by rising rates also because of their lower 9 year duration. All I know is, that the banks and Federal Reserve have been constantly wrong about their predictions on rising rates for five years, so be skeptical of any rate predictions. Better let algorithms decide how to change bond allocations. Disclosure: The author has no positions in any stocks mentioned, and no plans to initiate any positions within the next 72 hours. (More…) The author wrote this article themselves, and it expresses their own opinions. The author is not receiving compensation for it. The author has no business relationship with any company whose stock is mentioned in this article.

Saving Greece? What ETF Investors Should Really Be Focused On

February has been a terrible month for the U.S. economy, but a wonderful month for U.S. stocks. Perhaps ironically, even as an institutional investor, I am not finding myself particularly bearish. On the contrary. I see opportunity to continue riding severely overvalued market-based securities higher. February has been a terrible month for the U.S. economy, but a wonderful month for U.S. stocks. Translation? Investors do not believe that the Federal Reserve will raise overnight lending rates during an economic slowdown. Just how abysmal have the data been so far? Personal spending, construction spending, factory orders, international trade, business inventories, wholesale inventories, consumer sentiment, retail sales and housing starts are just a few of the data points that fell short of expectations. Heck, the Citi Economic Surprise Index recently demonstrated that data points have missed analyst forecasts by the most in more than two years. Most blame the weakening U.S. situation on decelerating activity around the globe. Goldman Sachs has gone so far as to say that the global economy has entered a contraction phase, with six of its seven Global Leading Indicator (GLI) components worsening in February. The lone holdout? U.S. Initial Jobless Claims. Indeed, a low level of unemployment filings coupled with a consistent string of 200,000-plus net new jobs are the positives on the domestic scene. Yet even here, the employment rate as defined by labor force participation is under 63% – percentages that are typically associated with the 1970s. If millions upon millions of working-aged individuals did not give up the search for employment or “retire” since 1/1/2009, back when 66% of working-aged people had jobs, headline unemployment in the U.S. would be above 10.0%. (Naturally, 5.7% unemployment sounds better for those who want to believe that circumstances are much rosier than they really are.) Without question, the U.S. is not an island of self-sustaining expansion. As much as the media portray oil price declines as a windfall for stateside consumers, the slump across the entire commodity space (e.g., metals, agriculture, gas, etc.) communicates anemic demand. Equally troubling, none of the spectacular job gains have translated into significant wage growth in a way that price pressures might rise. (For what it is worth, Wal-Mart (NYSE: WMT ) did raise its wages above Federally mandated minimums for all of its low-earning employees.) Worse yet, depreciating currencies against the U.S. dollar have adversely affected the trade balance such that the Fed acknowledged the dollar’s rapid rise as a “persistent source of restraint” on exports. The Fed is not the only group that has expressed concern about dollar strength. Corporations have blamed the dollar for missing earnings targets, as well as used the currency to guide future earnings projections lower. And analysts have dramatically scaled back profit-per-share outlooks for the S&P 500 from nearly 8%-10% in November to 0%-2% here in February. What do lower earnings projections mean? In essence, the Forward 12-month P/E was the last remaining valuation technique that supported the reasonableness of the current price people are paying for the S&P 500. Not anymore. Cyclical, trailing 12-month and forward 12-month price-to earnings (P/E), price-to-sales (P/S), price-to-book (P/B) and price-to-cash flow (P/CF) all suggest S&P 500 overvaluation. In spite of the seemingly obvious concerns investors should have about U.S. equities, bearish sentiment in the American Association of Individual Investors (AAII) is at a meager 17.88%. According to Bespoke Research, there have been only five weeks of the last 300 where bearish sentiment was lower. Perhaps ironically, even as an institutional investor, I am not finding myself particularly bearish. On the contrary. I see opportunity to continue riding severely overvalued market-based securities higher; that is, there’s no reason to exit the central bank stimulus bubble when the world’s investors have so much faith in their policies. Overvaluation can beget irrational exuberance, and irrational exuberance can beget insane euphoria. It can go on for weeks, months or years. The only caveat? You have to realize the reality that asset prices have gone rogue, and that you will need an insurance plan for reducing risk when the inevitable blow-up transpires. My approach is threefold. First, hold the stock assets that continue to trend higher. Each needs to remain above a a significant trendline like a 200-day moving average; a downside breach should not last more than a couple of days. Some of my favorites? The Vanguard Dividend Appreciation ETF (NYSEARCA: VIG ), the Vanguard Mega Cap Growth ETF (NYSEARCA: MGK ), the Health Care Select Sect SPDR ETF (NYSEARCA: XLV ) and the Vanguard Information Technology ETF (NYSEARCA: VGT ). Additionally, add exposure to assets where you see value, as I have with the iShares Currency Hedged MSCI Germany ETF (NYSEARCA: HEWG ), or add exposure to where you’ve witnessed momentum, as I have with the PureFunds ISE Cyber Security ETF (NYSEARCA: HACK ). Second, recognize that the appeal of long-term U.S. bonds will not dissipate in a weakening global economy. Fits and starts? Sure. Yet long-term U.S treasury proxies yield more than comparable sovereign debt abroad. Buying the bond dips can be as lucrative as buying stocks when they pull back. What’s more, funds like the iShares 20+ Year Treasury Bond ETF (NYSEARCA: TLT ) and the Vanguard Long-Term Bond ETF (NYSEARCA: BLV ) have made more money over the last 15 months than ETFs like the SPDR S&P 500 Trust ETF (NYSEARCA: SPY ) or the Vanguard Total Stock Market ETF (NYSEARCA: VTI ). (Note: Readers know that I have been advocating exposure to longer-term maturities since December of 2013.) Third, there are a wide variety of things that could derail the respective rallies in stocks and bonds. Policy mistakes by one or more of the major central banks around the globe could cause an exodus. A monumental shift toward global acceleration in the worldwide economy would likely catch investors off guard. A decline in oil prices below the current line in the sand at $45 per barrel could cause hardship and/or civil unrest in export-dependent countries. A less-than-graceful exit from the eurozone by Greece (at some point in 2014) could affect the investing landscape. Even an unforeseen event(s) could take market-based securities for a ride where the price declines lead to bearish panic rather than bullish dip-buying opportunity. Disclosure: Gary Gordon, MS, CFP is the president of Pacific Park Financial, Inc., a Registered Investment Adviser with the SEC. Gary Gordon, Pacific Park Financial, Inc, and/or its clients may hold positions in the ETFs, mutual funds, and/or any investment asset mentioned above. The commentary does not constitute individualized investment advice. The opinions offered herein are not personalized recommendations to buy, sell or hold securities. At times, issuers of exchange-traded products compensate Pacific Park Financial, Inc. or its subsidiaries for advertising at the ETF Expert web site. ETF Expert content is created independently of any advertising relationships.