Scalper1 News
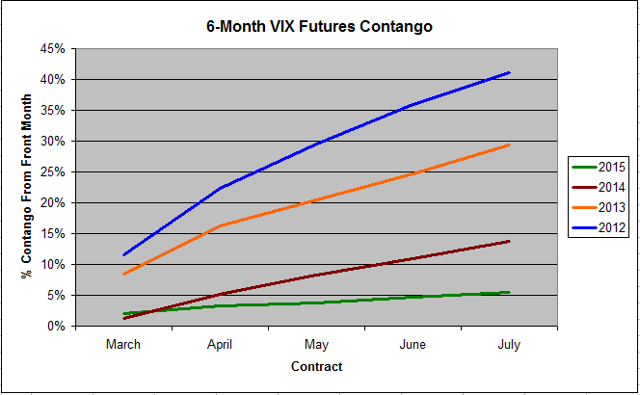
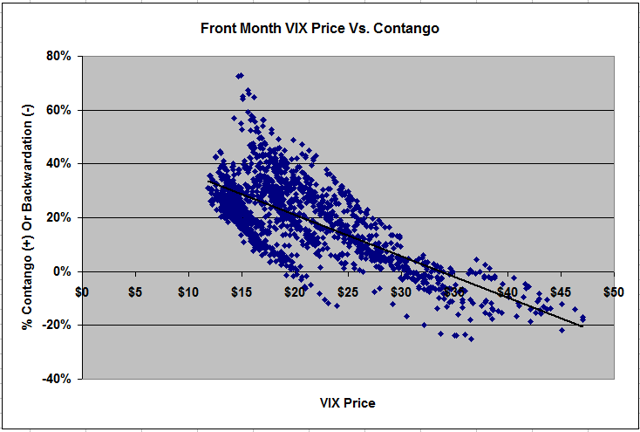
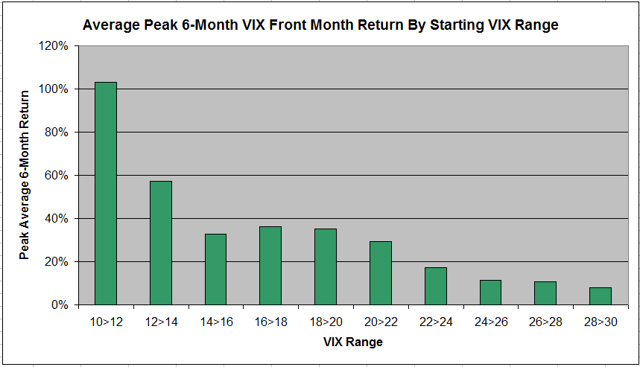
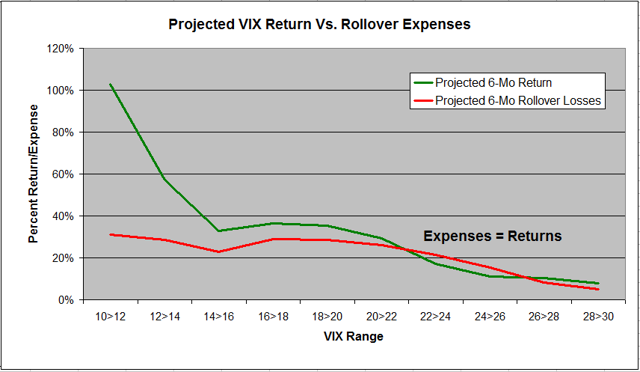
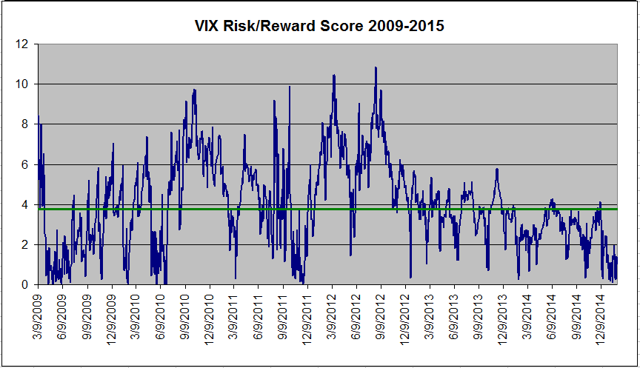
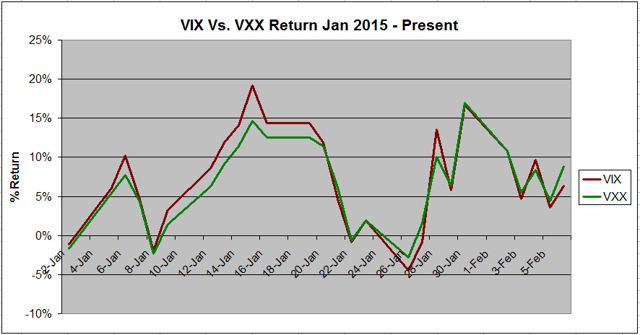
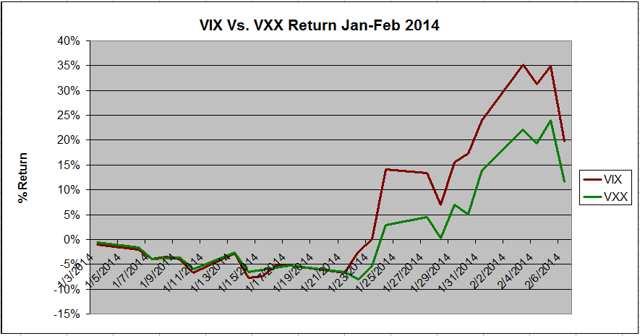 Contango-associated rollover losses have traditionally made holding volatility ETFs for more than a few weeks a dangerous proposition. Over the last two months, however, the VIX futures strip on which volatility ETFs are based has flattened reducing the expense of holding funds such as VXX and TVIX. There is an inverse relationship between VIX price and magnitude of contango. A VIX Risk/Reward score can be used to pinpoint ideal entrypoints for a buy-and-hold position in volatility ETFs. With a current value I have written multiple articles over the past 6 months- Here , Here , and Here -advocating shorting volatility ETFs to take advantage of monthly rollover losses. Recent develops in the VIX Futures market on which volatility ETFs are based, however, has made the sector more attractive as a longer term buy-and-hold position. Anybody who has traded volatility ETFs over the past five years knows that there is a constant uphill battle against the forces of contango. Volatility spikes can generate tremendous short-term gains in these ETFs, but the funds tend to underperform dramatically while awaiting these surges in volatility. While the volatility ETFs are traditionally associated with the VIX-the S&P 500 volatility index-the funds actually hold near-term VIX futures contracts. These contracts expire on a monthly basis and the fund must sell all of its front month contracts and role those funds over into the next month’s contract prior to expiration. Since the market bottom in March of 2009, these later month VIX futures contracts have been persistently more expensive than the front-month, expiring contract, a situation known as contango. This is not that surprising as volatility has been historically low as the markets have rallied these past five years keeping near term volatility low while the prospect of a future market correction has forced investors to pay premiums for later contracts. Unfortunately, this phenomenon has been devastating to short term volatility ETFs such as the iPath S&P 500 VIX Short-Term Futures ETN (NYSEARCA: VXX ) and the leveraged VelocityShares Daily 2x VIX Short-Term ETN (NASDAQ: TVIX ). Each time a fund roles over to a new contract that is in contango, it can buy fewer shares than it just sold, and over time, this results in a significant underperformance of the ETF versus the futures market on which it is based. In 2013, for example, the VIX front month futures lost 10.6% as volatility continued its decline while VXX was down a massive 62%. The 2x leveraged ETF TVIX fared even worse, down 89.8% versus a predicted loss of 21.2%. It is for this reason that I argued for shorting VXX and actively avoiding TVIX as a long term investment in previous articles. Over the past month or two, however, the VIX Futures pattern has evolved to one that I believe to be much more favorable to longer-term traders. Figure 1 below shows the % premium of each contract in the six-month VIX Futures Strip for February 2015 through July compared to the same period in 2014, 2013, and 2012. (click to enlarge) Figure 1: 6-Month Contango 2012-2015 (Source: Yahoo Finance Historical Quotes) It is clear that there has been a flattening of the VIX futures curve in 2015 versus previous years meaning that rollover losses will be limited for volatility ETFs. As of Friday’s close, holding VXX for the next sixth months would result in just a 5.5% rollover-associated loss, assuming no change to the Futures Strip. This compares to a 14% projected loss during the same period in 2014, 29% in 2013 and a disastrous 41% in 2012. Holders of the leveraged ETF TVIX can expect these losses to be doubled. However, this only tells half of the story. There is an inverse relationship between VIX future price and contango. Figure 2 below shows a scatterplot of front-month VIX price against 6-month contango using data for the past five years. As the price of the front-month VIX contract increases, the level of contango tends to decrease. In fact, once the VIX futures reach a certain level-somewhere above 20–the contacts tend slip into backwardation, the opposite of contango in which rollovers actually benefit the longs. (click to enlarge) Figure 2: Over the last 5+ Years, as VIX Futures Price decreases, Contango tends to increase (Source: Yahoo Finance Historical Quotes) At the same time, however, higher VIX levels have a much higher probability to mean revert to the average VIX level, which, over the last 5-years is somewhere around 18, as the market rallies. Figure 3 below shows the average peak six-month return based on the front-month VIX futures contract based on initial VIX starting price. (click to enlarge) Figure 3: Average Peak 6-month return by VIX range (Source: Yahoo Finance Historical Quotes) When the VIX price is less than 12, the average peak six-month return is over 100%, which stabilizes at around 35% between 14 and 20, and then slows to less than 8% when the front month VIX futures is above 30. What is needed, therefore, is a balance between a low VIX entry price while maintaining as minimal level of contango as possible. Sure, a cheap VIX may mean the possibility of a large return on a VIX spike, but you will pay for it through steep rollover losses awaiting for that singular moment. On the other hand, an elevated VIX means that rollover losses will be minimal and it will be cheap to hold the ETF for an extended period of time, but the probability of profiting from a spiking VIX will be much more limited. Overlaying the data from Figures 2-representing the expense curve-and Figure 3-representing the returns curve-produces the chart shown below in Figure 4. This graph implies that at VIX futures prices when the returns curve is greater than the expenses curve, the risk-reward profile is in favor of the longer term holder (that is, out to six-months). However, once the curves intersect at around 22, projected expenses equal projected returns and a buy-and-hold trade is no longer worthwhile. (click to enlarge) Figure 4: Historical projected 6-month return and expenses by VIX range (Source: Yahoo Finance Historical Quotes) This is a good theoretical exercise, but relies on historical averages. What does the current picture look like? A cheap VIX/low contango metric can be calculated simply by multiplying the absolute value of the contango (or backwardation) by the current front month VIX futures contract price. The lower that this number is, the greater the potential for profit while limiting rollover losses. Figure 5 below shows this VIX Risk/Reward Score over the past five years. (click to enlarge) Figure 5: VIX Risk/Reward Score Over the past 5+ years where lower values suggest favorable buying opportunities (Source: Yahoo Finance Historical Quotes) As of Friday’s closing front-month VIX Futures price of $19.18 with a six-month contango of 5.5%, the VIX Risk/Reward Score is 1.05 which, as figure 5 illustrates, is well below the 5-year average of 3.78, indicating a good risk/reward for going long volatility. Indeed, Friday’s close is in the 92nd percentile indicating a historically low score. This effectively allows us to take the projected VIX Expenses curve in Figure 4, which shows an historical average of about a 25% 6-month contango-associated loss at current levels, and shift it downward to match the current 5% projected loss. The proof, as they say, is in the pudding. The VIX risk/reward score has been Scalper1 News
Scalper1 News