Scalper1 News
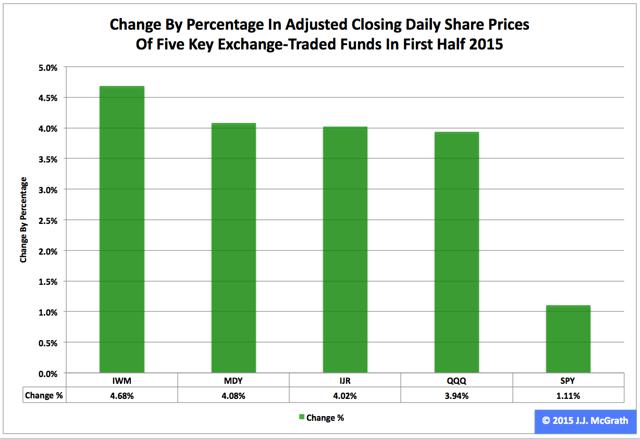
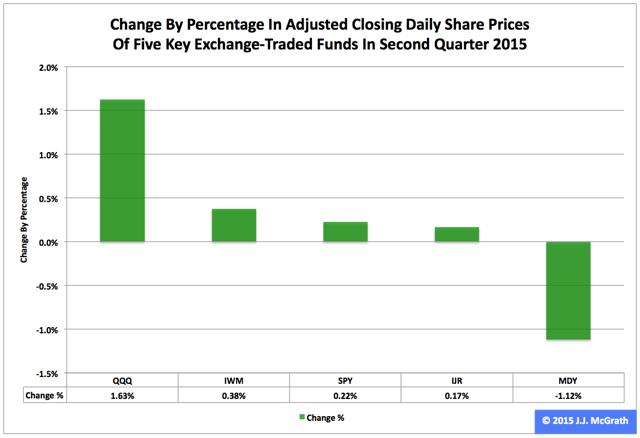
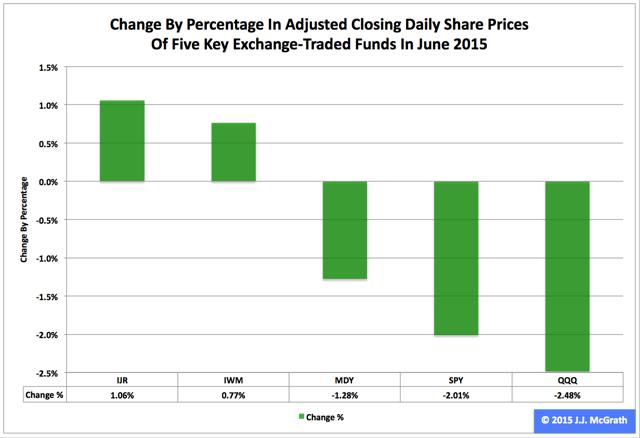
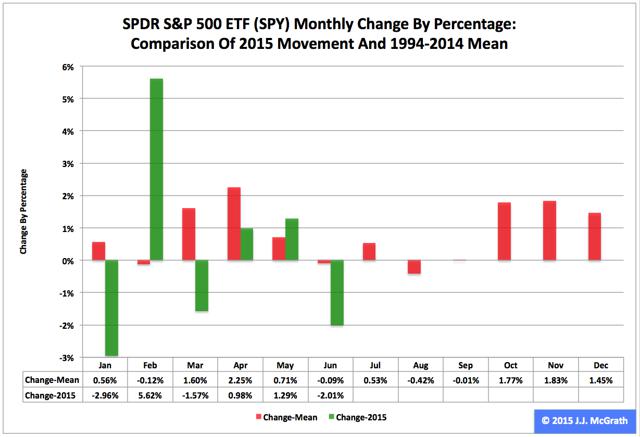
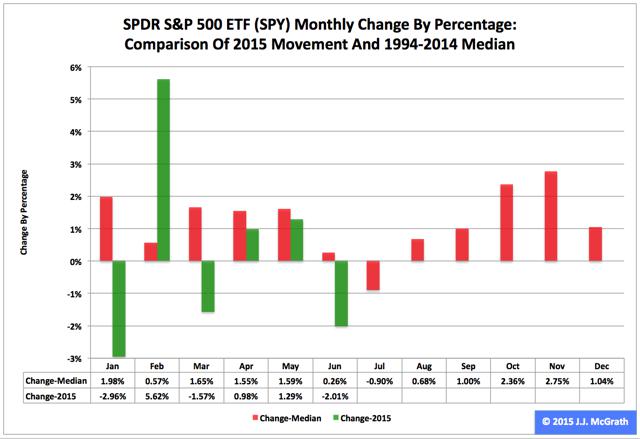 Summary The SPDR S&P 500 ETF in the first half ranked No. 3 among the three most popular exchange-traded funds based on the S&P Composite 1500’s constituent indexes. In the second quarter, the ETF’s adjusted closing daily share price advanced by a rather small 0.22 percent. In June, the fund’s share price declined by a rather large -2.01 percent. The SPDR S&P 500 ETF (NYSEARCA: SPY ) during 2015’s first half was third by return among the three most popular ETFs based on the S&P Composite 1500’s constituent indexes, which encompass the SPDR S&P MidCap 400 ETF (NYSEARCA: MDY ) and the iShares Core S&P Small-Cap ETF (NYSEARCA: IJR ). SPY edged higher to $205.89 from $203.64, an increase of $2.25, or 1.11 percent, but it behaved worse than MDY by -2.98 percentage points and IJR by -2.91 percentage points. Figure 1: Change In Share Prices Of Five Key ETFs In First Half (click to enlarge) Source: This J.J.’s Risky Business chart is based on analyses of adjusted closing daily share prices at Yahoo Finance . Market day in and market day out, I analyze in multiple ways 13 ETFs through my Risky Business Daily Market Seismometer : These funds are SPY, MDY and IJR, as well as the nine Select Sector SPDRs and the small-capitalization iShares Russell 2000 ETF (NYSEARCA: IWM ). I also assess the large-cap (and technology-dominated) PowerShares QQQ (NASDAQ: QQQ ), albeit on a comparatively infrequent basis. Thanks to this monitoring, I anticipate being shocked by market events on occasion, but I do not expect being surprised by them. Anyway, SPY in the first half of the year was the worst performer among the five key ETFs I employ to evaluate equity classes by market cap (Figure 1). Figure 2: Change In Share Prices Of Five Key ETFs In Second Quarter (click to enlarge) Source: This J.J.’s Risky Business chart is based on analyses of adjusted closing daily share prices at Yahoo Finance. SPY was neither the best behaved nor the worst behaved of my five key ETFs last quarter, as these distinctions were claimed by QQQ in the former case and MDY in the latter case (Figure 2). I believe SPY’s lackluster performance, not only in Q2 but also in 2015, is associated with the bias divergence in monetary policy at big central banks around the world whose effects I have discussed ad nauseam at Seeking Alpha, most recently in “NYSE Margin Debt Remains Near All-Time High In May: Risk Rank At No. 53.” Figure 3: Changes In Share Prices Of Five Key ETFs In June (click to enlarge) Source: This J.J.’s Risky Business chart is based on analyses of adjusted closing daily share prices at Yahoo Finance. Greece’s failure to make its payment to the International Monetary Fund Tuesday was preceded by a protracted period of silly shilly-shallying uncommon even by the standards of the eurozone, which is really saying something. The headline risk clearly had an impact on the U.S. stock market, with the beatdown victimizing larger caps more than smaller caps (Figure 3). This disparity in outcomes makes sense because the S&P 500 index firms that provided the data required to paint a complete picture of their global sales in 2012 indicated they booked 53.4 percent of their sales inside the U.S. and 46.6 percent of their sales outside the U.S., as discussed elsewhere . The comparable numbers for S&P 600 index firms the same year were 61.0 percent and 39.0 percent, in that order. As a result, SPY is more exposed to conditions around the world than is IJR. Figure 4: SPY Monthly Change, 2015 Vs. 1994-2014 Mean (click to enlarge) Source: This J.J.’s Risky Business chart is based on analyses of adjusted closing monthly share prices at Yahoo Finance . SPY behaved a lot worse in the first half of 2015 than it did during the comparable periods in its initial 21 full years of existence based on the monthly means calculated by employing data associated with that historical time frame (Figure 4). The same data set shows the average year’s strongest quarter was the fourth, with an absolutely large positive return, and its weakest quarter was the third, with an absolutely small positive return. Figure 5: SPY Monthly Change, 2015 Vs. 1994-2014 Median (click to enlarge) Source: This J.J.’s Risky Business chart is based on analyses of adjusted closing monthly share prices at Yahoo Finance. SPY also performed a lot worse in the first half of 2015 than it did during the comparable periods in its initial 21 full years of existence based on the monthly medians calculated by using data associated with that historical time frame (Figure 5). The same data set shows the average year’s strongest quarter was the fourth, with an absolutely large positive return, and its weakest quarter was the third, with an absolutely small positive return. Disclaimer: The opinions expressed herein by the author do not constitute an investment recommendation, and they are unsuitable for employment in the making of investment decisions. The opinions expressed herein address only certain aspects of potential investment in any securities and cannot substitute for comprehensive investment analysis. The opinions expressed herein are based on an incomplete set of information, illustrative in nature, and limited in scope. In addition, the opinions expressed herein reflect the author’s best judgment as of the date of publication, and they are subject to change without notice. Disclosure: I/we have no positions in any stocks mentioned, and no plans to initiate any positions within the next 72 hours. (More…) I wrote this article myself, and it expresses my own opinions. I am not receiving compensation for it (other than from Seeking Alpha). I have no business relationship with any company whose stock is mentioned in this article. Scalper1 News
Scalper1 News