Scalper1 News
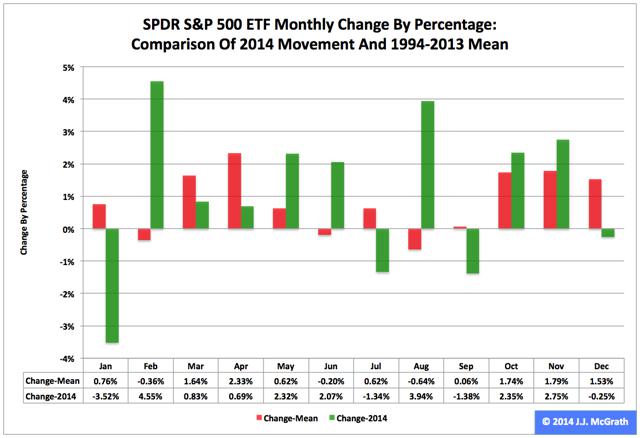
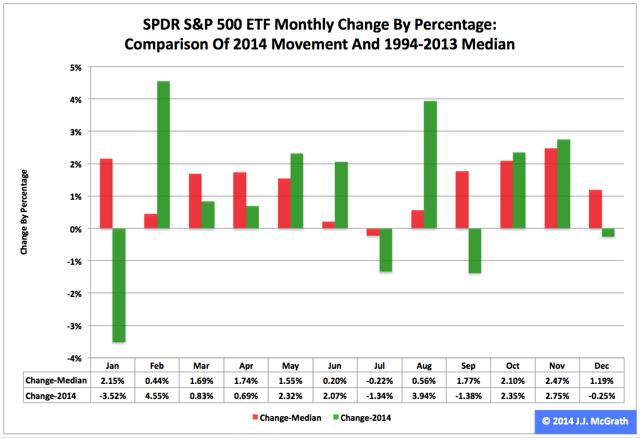 Summary The SPDR S&P 500 ETF ranked No. 1 in 2014 among the three most popular exchange-traded funds based on the S&P 1500’s constituent indexes. Most recently, the ETF’s adjusted closing daily share price last month declined to $205.54 from $206.06, a loss of -$0.52, or -0.25 percent. The last time the ETF had a negative return in the seasonally strong month of December was 2007. The SPDR S&P 500 ETF (NYSEARCA: SPY ) ranked first by return during 2014 among the three most popular ETFs based on the S&P 1500’s constituent indexes, which also encompass the SPDR S&P MidCap 400 ETF (NYSEARCA: MDY ) and the iShares Core S&P Small-Cap ETF (NYSEARCA: IJR ). SPY advanced to $205.54 from $181.15, a gain of $24.39, or 13.46 percent, in terms of adjusted closing daily share prices. Neither seasonality nor U.S Federal Reserve policy appears likely to be supportive of SPY at its current elevated level over the coming quarter. The Federal Open Market Committee announced the end of asset purchases under its third formal quantitative-easing program Oct. 29 and may announce the beginning of its next round of federal-funds-rate increases April 29. Figure 1: SPY Monthly Change, 2014 Vs. 1994-2013 Mean (click to enlarge) Source: This J.J.’s Risky Business chart is based on analyses of adjusted closing monthly share prices at Yahoo Finance . SPY behaved better in 2014 than it did over its initial 20 full years of existence based on the monthly means calculated by employing data associated with that historical time frame (Figure 1). The same data set shows the average year’s strongest quarter was the fourth, with an absolutely large positive return, and its weakest quarter was the third, with an absolutely small positive return. The last time the ETF had a negative return in the seasonally strong month of December was 2007. Figure 2: SPY Monthly Change, 2014 Vs. 1994-2013 Median (click to enlarge) Source: This J.J.’s Risky Business chart is based on analyses of adjusted closing monthly share prices at Yahoo Finance. SPY behaved worse in 2014 than it did over its initial 20 full years of existence based on the monthly medians calculated by using data associated with that historical time frame (Figure 2). The same data set shows the average year’s strongest quarter was the fourth, with an absolutely large positive return, and its weakest quarter was the third, with a relatively small positive return. Last year, the ETF performed best in the second quarter and worst in the third quarter. Disclaimer: The opinions expressed herein by the author do not constitute an investment recommendation, and they are unsuitable for employment in the making of investment decisions. The opinions expressed herein address only certain aspects of potential investment in any securities and cannot substitute for comprehensive investment analysis. The opinions expressed herein are based on an incomplete set of information, illustrative in nature, and limited in scope. In addition, the opinions expressed herein reflect the author’s best judgment as of the date of publication, and they are subject to change without notice. Now that you’ve read this, are you Bullish or Bearish on ? Bullish Bearish Sentiment on ( ) Thanks for sharing your thoughts. Why are you ? Submit & View Results Skip to results » Share this article with a colleague Scalper1 News
Scalper1 News