Scalper1 News
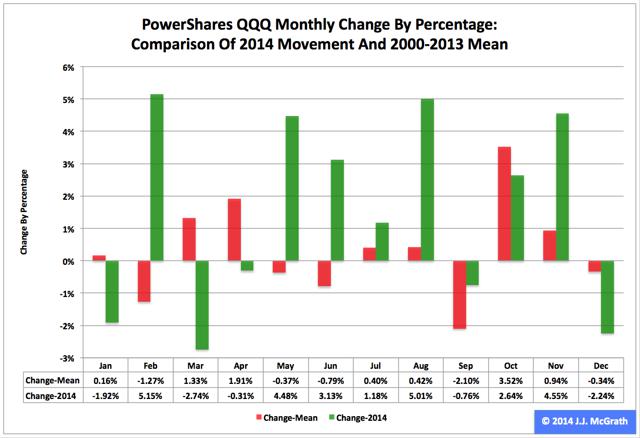
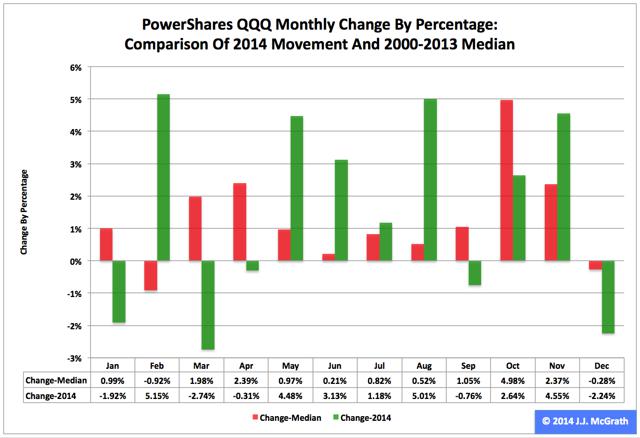
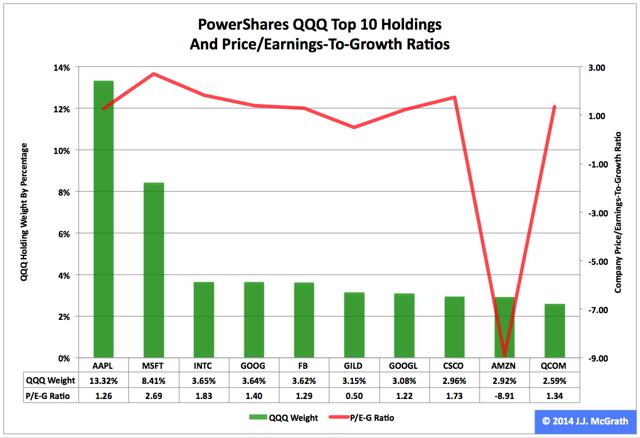 Summary PowerShares QQQ behaved better in 2014 than the three most popular exchange-traded funds based on the S&P 1500’s constituent indexes. However, the derivative of the Nasdaq-100 Index dominated by information technology was not a leader, but a laggard in the fourth quarter. Neither major central bank policies nor related moves in the euro and U.S. dollar currency pair appear likely to help the fund’s performance in the first quarter. The PowerShares QQQ Trust ETF (NASDAQ: QQQ ) had a supercharged 2014, as the ETF skyrocketed to $103.25 from $86.63, a soaring of $16.62, or 19.19 percent, on an adjusted closing daily share price basis. During the year, it outdistanced the SPDR S&P 500 ETF (NYSEARCA: SPY ) by 5.72 percentage points, the SPDR S&P MidCap 400 Trust ETF (NYSEARCA: MDY ) by 9.79 points and the iShares Core S&P Small-Cap ETF (NYSEARCA: IJR ) by 13.34 points. Over the fourth quarter, however, QQQ lost momentum on a relative basis, as it lagged IJR and MDY by -4.89 and -1.40 percentage points, in that order, and led SPY by a measly 0.01 point. Consistent with its seasonal tendency, QQQ capped a very good 2014 with a very bad December, as it was outpaced by IJR, MDY and SPY by -5.14, -3.08 and -1.99 percentage points, respectively. Figure 1: QQQ Monthly Change, 2014 Vs. 2000-2013 Mean (click to enlarge) Source: This J.J.’s Risky Business chart is based on analyses of adjusted closing monthly share prices at Yahoo Finance . QQQ behaved a lot better in 2014 than it did during its initial 14 full years of existence based on the monthly means calculated by employing data associated with that historical time frame (Figure 1). The same data set shows the average year’s weakest quarter was the third, with a relatively large negative return, and its strongest quarter was the fourth, with an absolutely large positive return. Inconsistent with this pattern, the ETF last year made its biggest advances in Q2 and Q3, in that order. Figure 2: QQQ Monthly Change, 2014 Vs. 2000-2013 Median (click to enlarge) Source: This J.J.’s Risky Business chart is based on analyses of adjusted closing monthly share prices at Yahoo Finance. QQQ also behaved a lot better in 2014 than it did during its initial 14 full years of existence based on the monthly medians calculated by using data associated with that historical time frame (Figure 2). The same data set shows the average year’s weakest quarter was the first, with a relatively small positive return, and its strongest quarter was the fourth, with an absolutely large positive return. Clearly, this means there is no historical statistical tendency for the ETF to explode in Q1. Figure 3: PowerShares QQQ Top 10 Holdings, Jan. 6 (click to enlarge) Note: The QQQ holding-weight-by-percentage scale is on the left (green), and the company price/earnings-to-growth ratio scale is on the right (red). Source: This J.J.’s Risky Business chart is based on data at Invesco’s PowerShares QQQ microsite and Yahoo Finance (both current as of Jan. 6). I anticipate one of the biggest headwinds buffeting the large-capitalization QQQ in the first quarter of this year may be the bias divergence in monetary policy at major central banks around the world. On the one hand, the U.S. Federal Reserve is oriented toward tightening; on the other hand, the Bank of Japan, European Central Bank and People’s Bank of China are oriented toward loosening. This divergence has had important effects on exchange rates, such as in the euro and U.S. dollar currency pair, or EUR/USD. It is worth mentioning in this context that the Fed announced the end of asset purchases under its latest quantitative easing program, aka QE3+, Oct. 29, and may announce the beginning of interest rate hikes April 29. Its conclusion of purchases under its first two formal QE programs this century is associated with both a correction and a bear market in large cap equities, as evidenced by SPY’s slipping -17.19 percent in 2010 and sliding -21.69 percent in 2011. The bias divergence at the major central banks has been reflected by action in the EUR/USD cross, which dipped from as high as $1.3992 May 8 to as low as $1.1880 Jan. 5, a drop of -$0.2112, or -15.09 percent, based on data at StockCharts.com . This change in EUR/USD and similar moves in other currency pairs indicate a strengthening greenback and a weakening everything else that could pressure earnings of U.S. companies in sectors with substantial international businesses. Clearly, many technology companies fit this description. In terms of exposure to the tech sector, Invesco reported QQQ’s is 58.07 percent at this time. Meanwhile, valuation may become increasingly important to stock market participants in the short to intermediate terms, especially given the synchronized slowdowns in national (and supranational) economies around the world. Except for Gilead Sciences Inc. (NASDAQ: GILD ), QQQ’s top 10 holdings appear to range from fairly valued to overvalued to absurdly valued (Figure 3). And these kinds of valuations seem unlikely to function as tailwinds for the ETF this quarter. Disclaimer: The opinions expressed herein by the author do not constitute an investment recommendation, and they are unsuitable for employment in the making of investment decisions. The opinions expressed herein address only certain aspects of potential investment in any securities and cannot substitute for comprehensive investment analysis. The opinions expressed herein are based on an incomplete set of information, illustrative in nature, and limited in scope. In addition, the opinions expressed herein reflect the author’s best judgment as of the date of publication, and they are subject to change without notice. Scalper1 News
Scalper1 News