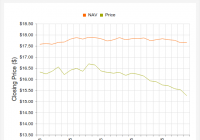
Summary This article highlights five closed-end bond funds which have attractive yields, greater discounts than usual, and solid distribution histories. Starting around March 2015, many bond CEFs have seen significant sell-offs, in spite of stable NAVs creating large discounts, probably due to fears of rising interest rates. Fears of the Fed raising interest rates materially within the short term are now perceived by many as overdone. However, the energy sector continues to face some challenges, which ripple through to funds such as these, which invest in corporate debt in that industry. While global political uncertainties persist in many parts of the world (e.g., Ukraine, Greece, the Middle East), the financial markets seem to be taking that in their stride. First of all, you should already know something about closed-end funds, or “CEFs”. Otherwise, this article might not make much sense to you. I refer those of you who are unfamiliar with this investment category to one of the many excellent basic tutorials out there, for example this SA article or those on the Morningstar website . Especially important is to understand the difference between a CEF and an open-ended, or regular mutual fund or ETF, and how the share price of a CEF can trade at a discount or a premium to the actual inherent share value, or net asset value – and why it usually makes sense to buy funds which are trading at a discount instead of a premium. There are also several contributors to Seeking Alpha who have written some great articles about CEFs, for example Douglas Albo , George Spritzer , Reuben Gregg Brewer , Joe Eqcome (aka Robert A. Frank, CFA), Betalyst , and surely many others I do not yet know about. Actually, just about everything I know about CEF investing I learned from reading articles by these authors. As a classically trained musician, I do not have a background in financial matters. I am specifically interested in CEFs which invest in high-yielding bonds, because I had already been invested in the Brookfield High Income Fund Inc. (NYSE: HHY ) (before July 2014, when this was still one of the Helios family of funds, HIH, which later merged into one single fund) and because there were one or two other bond funds I wanted to compare with similar funds for a specific reason… but more about that later. There are also CEFs which invest in REITs and mREITs; some CEFs specialize in MLPs or utilities, while others invest in emerging markets or even specific countries (Mexico, Thailand, etc.) or industry sectors (healthcare, technology, etc.). While equity CEFs can enhance their returns by using different kinds of sophisticated option strategies, and sometimes dividend capture techniques, bond funds usually use leverage (i.e., they borrow money) in order to buy more bonds than they could without the leverage. Since the cost of borrowing is typically much lower for large investment firms than for private investors, the returns from the extra bond coupons they receive will more than pay for all the interest and other expenses that have to be paid for borrowing the money… especially in today’s ZIRP environment (ZIRP = “zero interest rate policy”). When rates go up, the value of a bond declines. Floating-rate loans and short-duration bond holdings can adjust better to rising rates, but long-term bonds can be affected more. So I used the Fund Screener on the well-known CEF website to pull up a list of funds which fulfill the following criteria: Monthly distribution payments; Distribution rate (i.e., yield on share price) of about 9% or higher; Discount of market price to NAV (“net asset value”) of about -9% or wider; Leverage no higher than 30%; Total assets of $200M or greater. This brought up about 25 out of more than 500 funds, some of which are equity CEFs which invest mainly in stocks, and some of which are bond funds which invest in… you guessed it!… corporate bonds and similar forms of corporate and government debt obligations, such as Treasuries and senior secured loans. I am also always on the lookout for other high-yielding investments, so the non-bond funds were also interesting to see. I added the option “YTD return on NAV” without a constraint, which gave me the same funds, but now with an additional column which I could sort in descending order by clicking on the header. Then, I examined the funds one by one and looked at the distribution history (i.e., whether or not distributions were cut or raised, and the breakdown in categories of income/long-term gains/short-term gains/return of capital) and the portfolio composition. As for the latter, I was most interested in two things: the breakdown of portfolio allocation by credit rating, and the breakdown by sector. If the fund invests globally, often there is a breakdown by country (usually the top ten). For more detailed information, you have to go to the website for the fund’s management (or sponsor) and pull up the most recent fact sheet and/or the last annual or semi-annual report. Usually, one source of information is never going to be enough, and this is one of the things that make investing (in anything) very “interesting” at times. I eventually narrowed my selection down to these five: Prudential Short Duration High Yield Fund (NYSE: ISD ) Prudential Global Short Duration High Yield Fund, Inc. (NYSE: GHY ) Babson Capital Global Short Duration High Yield Fund (NYSE: BGH ) Virtus Global Multi-Sector Income Fund (NYSE: VGI ) Brookfield High Income Fund Inc. (HHY, mentioned above) Actually, I knew about the first two already due to one of the Seeking Alpha readers who commented on my PGZ article (thanks, Bea!), but after seeing the widening discounts on these, I did a little more research to see whether this was a phenomenon isolated to those funds, or if it was something else that other funds were also experiencing, something generic to bond funds. The latter seems to be the case. There isn’t a lot of information out there about some of these bond funds, perhaps because they all tend to be thinly traded, so it pays to do some in-depth research by reading the literature, reports, and SEC filings you can find on each company’s website. All of the five selected funds have the following characteristics in common, in addition to being closed-end funds: They invest predominantly in bonds, as well as other forms of corporate and government debt (e.g., senior secured loans, or U.S. and global Treasury obligations); All invest mainly in assets in the USA; All have some global exposure in varying, but mostly smaller, proportions (HHY has very little global exposure; BGH, VGI, and GHY have more, of course); All use some degree of leverage, usually between 24% and 28%; All pay distributions on a monthly basis; All but HHY have relatively short track records, so they are somewhat riskier than funds which have been around longer. Some of the main differences are: Duration of bond holdings: Three of the five funds are concentrated in short-duration investments. Short-duration bonds typically have lower yields, but are less sensitive to interest rate hikes, and are considered to have the highest liquidity. Lack of liquidity is being perceived as a problem in the bond market these days, as Bill Gross has pointed out recently , so an investment in short-duration bonds should be more desirable in such an environment (read more about this here ); Credit quality of assets: While all of these funds do invest in “junk bonds”, there is considerable variation in the percentage of assets of higher credit quality. Of these five, only VGI has a substantial amount of assets rated as investment-grade (i.e., rated “BBB” or higher); Distribution histories and sources (i.e., tax characteristics): These can vary, although I selected funds which haven’t cut their distributions within the past several years. All but VGI do not have an element of return of capital (“ROC”), and that only since April 2015 (read more about that in the details for VGI below); Breakdown by country: The breakdown of individual global investments will vary according to percent of allocation and location; Breakdown by industry: Allocation to industry sectors is, of course, another big (and important) variable. Most bond funds saw significant declines in NAV over the latter part of 2014, especially if a significant portion of their portfolio was in energy-related or utilities-related assets. However, most of the NAVs of these funds seem to have stabilized across the board since January, although they haven’t all gone up to a great extent. But Mr. Market has taken a rather unfavorable view of these high-income investments lately, as we shall see from the following comparisons of market valuation versus net asset value. We have all heard of the “taper tantrum” which happened in May 2013. Back then, we saw a massive sell-off of these and similar other funds due to a knee-jerk reaction of investors to the announcement that QE (“quantitative easing”) would soon come to an end. Some investors with clear heads recognized the panic behind the sell-off and took advantage of what turned out to be a great buying opportunity. This time, I believe we are seeing a repeat of the “taper tantrum”, but in slow motion. Contrary to the first “taper tantrum”, where fear was the predominant motivation for the sell-off, there are very real issues this time, such as low oil prices and general weakness in the energy sector, which rippled through to some funds which have a high degree of exposure to that industry. Most of that took place in the latter half of 2014, but many people believe that we haven’t seen the end of it yet. They say “a picture is worth a thousand words” , so I’ll start out each fund’s résumé with a picture of the chart of the market price versus NAV beginning on January 1, 2015 until today (July 1, 2015) taken from the CEF website. Data presented below, unless otherwise indicated, was taken from the CEF website on July 1, 2015. All quoted material is copyrighted by the source named, and is used here under the assumption of the “fair use” provision of the DMCA . ISD – Prudential Short Duration High Yield Fund Fund sponsor’s website (click on the tab: “Closed-End Funds”) Description (from cefconnect.com) : “The Fund seeks high current income by investing primarily in a diversified portfolio of high yield fixed income instruments that are rated below investment grade or, if unrated, are considered by the investment subadviser to be of comparable quality.” From the latest Fact Sheet (3/31/2015): “The Fund seeks to provide a high level of current income by investing primarily in higher-rated, below investment-grade fixed income instruments. The Fund seeks to maintain a weighted average portfolio duration of three years or less and a weighted average maturity of five years or less.” NAV: (Source: CEF website) Current: $17.61 52-wk. avg.: $18.03 52-wk. high: $18.80 52-wk. low: $17.50 Share price: (Source: CEF website) Current: $15.46 52-wk. avg.: $16.51 52-wk. high: $17.97 52-wk. low: $15.10 Discount/Premium to NAV: (Source: CEF website) Current: -12.21% 52-wk. avg.: -8.39% 52-wk. high: -4.36% 52-wk. low: -14.16% Distribution: (Source: CEF website) Amount (monthly): $0.1225 Yield on market price (current): 9.51% Total Net Assets: $831.615M Effective leverage: 28.99% Total expense ratio: 1.52% YTD return on NAV: 3.68% YTD return on price: -3.71% Avg. daily shares traded: 142,000 Credit ratings of investments: (Source: CEF website) BBB: 2.90% BB: 45.50% B: 44.50% CCC: 6.6% Other: 0.50% Summary: The fund has operated since April 30, 2012 (source: Fund’s fact sheet). Regular distributions have been constant at $0.1225 per month. Special dividends of $0.1278 and $0.1156 were paid in January 2014 and 2015, in addition to the regular distributions. All distributions consisted of ordinary income, no long-term or short-term gains, and no return of capital. Other remarks: ISD and another fund, GHY, are both sponsored by Prudential Investments LLC. According to the information on the CEF website, there seems to be no significant allocation to assets in energy-related or utility-related sectors. But according to the semi-annual report of November 2014, available on the fund sponsor’s website, the total allocation to the energy sector for the period reported was about 5%. Maybe they have since reduced their energy exposure even more, but we will have to wait until the next annual report to find out. It was also remarked in the same report that being underweight in energy had a beneficial effect on the fund’s performance. At any rate, 5% is considerably less than most of the other funds’ allocations to energy. GHY – Prudential Global Short Duration High Yield Fund, Inc. Fund sponsor’s website : (click on the tab: “Closed-End Funds”) Description (from cefconnect.com) : “The Fund seeks a high level of current income through investing in high yield fixed income instruments of issuers located around the world, including emerging markets.” From the latest Fact Sheet (3/31/2015): “The Fund seeks to provide a high level of current income by investing primarily in higher-rated, below investment-grade fixed income instruments of issuers located around the world, including emerging markets. The Fund seeks to maintain a weighted average portfolio duration of three years or less and a weighted average maturity of five years or less.” NAV: (Source: CEF website) Current: $17.20 52-wk. avg.: $17.74 52-wk. high: $18.81 52-wk. low: $17.09 Share price: (Source: CEF website) Current: $15.25 52-wk. avg.: $16.35 52-wk. high: $18.05 52-wk. low: $14.77 Discount/Premium to NAV: (Source: CEF website) Current: -11.34% 52-wk. avg.: -7.80% 52-wk. high: -3.75% 52-wk. low: -14.03% Distribution: (Source: CEF website) Amount (monthly): $0.1250 Yield on market price (current): 9.84% Total Net Assets: $968.854M Effective leverage: 27.35% Total expense ratio: 1.61% (source: fund’s fact sheet) YTD return on NAV: 3.85% YTD return on price: -0.38% Avg. daily shares traded: 185,000 Credit ratings of investments: (Source: CEF website) A: 0.3% BBB: 3.7% BB: 42.3% B: 46.7% CCC: 4.5% Other: 0.5% Country breakdown: (Source: CEF website) USA: 66.0% UK: 4.3% Luxembourg: 4.0% Canada: 3.4% Germany: 3.2% France: 2.8% Netherlands: 2.3% Brazil: 2.0% Other: 10.0% Summary: The fund has operated since December 26, 2012 (source: Fund’s fact sheet). Distributions have been constant at $0.1250 per month. One special dividend of $0.2540 was paid in January 2015, in addition to the regular distributions. All distributions consisted of regular income, no long-term or short-term gains, and no return of capital. Other remarks: As with ISD, also managed by Prudential Investments LLC, there seems to be no sizable allocation to assets in energy-related or utility-related sectors. BGH – Babson Capital Global Short Duration High Yield Fund Fund sponsor’s website Description (from cefconnect.com) : “The Fund seeks a high level of current income with capital preservation through investment in high yield bonds, loans and other income-producing securities.” From the latest Fact Sheet (5/31/2015): “OBJECTIVE: The Fund’s primary investment objective is to seek as high a level of current income as Babson Capital determines is consistent with capital preservation. The Fund seeks capital appreciation as a secondary investment objective when consistent with its primary investment objective. STRATEGY: The Fund will invest at least 80% of its Managed Assets in corporate bonds, loans and other income-producing instruments that are rated below investment grade – The Fund may invest up to 50% of its Managed Assets in bonds and loans issued by foreign companies – The Fund will seek to maintain a weighted average portfolio duration of 3 years or less.” NAV: (Source: CEF website) Current: $22.09 52-wk. avg.: $23.31 52-wk. high: $25.83 52-wk. low: $21.60 Share price: (Source: CEF website) Current: $19.93 52-wk. avg.: $21.81 52-wk. high: $24.51 52-wk. low: $19.51 Discount/Premium to NAV: (Source: CEF website) Current: -9.78% 52-wk. avg.: -6.42% 52-wk. high: -2.71% 52-wk. low: -11.72% Distribution: (Source: CEF website) Amount (monthly): $0.1677 Yield on market price (current): 10.10% Total Net Assets: $596.578M Effective leverage: 25.80% Total expense ratio: 2.21% YTD return on NAV: 5.09% YTD return on price: 3.62% Avg. daily shares traded: 95,000 Credit ratings of investments: (Source: Fund’s fact sheet) Baa: 0.0% Ba: 9.9% B: 78.1% other: 11.4% Country breakdown: (Source: Fund’s fact sheet) USA: 59.5% UK: 20.4% Canada: 2.9% France: 2.2% Sweden: 1.7% Industry sector allocations: (Source: Fund’s fact sheet) Oil and Gas: 20.0% Healthcare, Education and Childcare: 8.7% Finance: 7.9% Automobile: 6.8% Retail Stores: 6.7% Chemicals, Plastics and Rubber: 5.6% Buildings and Real Estate: 4.3% Telecommunications: 3.7% Cargo Transport: 3.6% Containers, Packaging and Glass: 3.2% Portfolio composition: (Source: Fund’s fact sheet) 1st Lien Senior Secured Loans: 2.5% Senior Secured Bonds: 47.1% Senior Unsecured Bonds: 35.7% 2nd Lien Senior Secured Loans: 14.1% Cash and Accrued Income: 0.6% Summary: The fund has operated since October 26, 2012 (source: Fund’s fact sheet). Regular distributions have been constant at $0.1667 per month. One special dividend of $0.5873 was paid in January 2015, in addition to the regular distributions. All distributions consisted of regular income, some short-term gains, and no return of capital. Other remarks: Although the fund’s NAV has increased more since the beginning of the year relative to some of the others in this article, the 20% allocation to the oil & gas sector would make me a little nervous, should I choose to invest here. I also like the credit ratings of ISD and GHY assets better with a 50/50 mix of “B/BB”, rather than those of BGH, which are more concentrated in the “B” range. VGI – Virtus Global Multi-Sector Income Fund Fund sponsor’s website Description: “The Fund seeks to maximize current income while preserving capital by investing in a portfolio of fixed income securities of U.S. and non-U.S. issuers.” From the latest Fact Sheet (3/31/2015): “The fund seeks to generate high current income and total return by applying extensive credit research and a time-tested approach to capitalize on opportunities across undervalued sectors of the global bond markets. The portfolio seeks global diversification among 14 sectors in order to potentially increase return and manage risk. A team of investment professionals provides significant research depth across all sectors of the global bond markets.” NAV: (Source: CEF website) Current: $17.96 52-wk. avg.: $18.68 52-wk. high: $19.92 52-wk. low: $17.20 Share price: (Source: CEF website) Current: $15.72 52-wk. avg.: $16.70 52-wk. high: $17.99 52-wk. low: $15.08 Discount/Premium to NAV: (Source: CEF website) Current: -12.47% 52-wk. avg.: -10.61% 52-wk. high: -5.94% 52-wk. low: -13.70% Distribution: (Source: CEF website) Amount (monthly): $0.1560 Yield on market price (current): 11.91% Total Net Assets: $286.144M Effective leverage: 27.31% Total expense ratio: 2.13% YTD return on NAV: 5.27% YTD return on price: 6.21% Avg. daily shares traded: 41,000 Credit ratings of investments: (Source: Fund’s fact sheet) Aaa: 8.78% Aa: 5.42% A: 14.35% Baa: 31.43% Ba: 23.11% B: 10.96% Caa: 4.10% Other: 1.86% Asset Allocation (from the annual report as of December 31, 2014 – the Fact Sheet has a somewhat different breakdown according to fixed-income categories, which I won’t repeat here. However, it is worth noting that the allocation to mortgage-backed securities, as stated in the Fact Sheet, is more like 7.8% – non-agency CMBS and RMBS and other MBS, summed together): (Source: Fund’s annual report as of Dec. 31, 2014) Corporate Bonds and Notes: 69% Financials: 30% Energy: 15% Materials: 7% Others: 17% Loan Agreements: 10% Foreign Government Securities: 10% Mortgage-Backed Securities: 4% Asset-Backed Securities: 3% Preferred Stock: 3% Other (includes short-term investment): 1% Country breakdown: (Source: Fund’s annual report as of Dec. 31, 2014) United States: 47% Brazil: 6% Mexico: 5% Chile: 4% Luxembourg: 3% Cayman Islands: 2% Indonesia: 1% Other: 31% Summary: The fund has operated since February 23, 2012 (source: Fund’s fact sheet). Distributions started at 0.1170 at inception, and were raised to 0.1200 in July 2013 and raised again to 0.1300 in October 2014. In April 2015, the fund adopted a managed distribution policy, which again raised the distribution by 20% for a monthly amount of $0.1560. The managed distribution policy introduced an element of return of capital from an option overlay strategy (source: Yahoo Finance ). A special dividend of $0.2500 was paid in January 2015, in addition to the regular distributions. All distributions consisted of regular income, some short-term gains, and no return of capital until April 2015, when the option overlay strategy was implemented. Other remarks: The 15% allocation to energy-related assets is a little high, but is less than the 20% of BGH and close to the average of most high-yield bond funds’ allocations (source: a very recent Seeking Alpha article, ” High-Yield Bonds Remain Attractive Despite Risks And Concerns “; see item no. 4 close to the top): (…) energy is the largest sector in the U.S. high-yield corporate bond market, with roughly 16% weight in the BofA Merrill Lynch High Yield bond Index… However, the credit quality of VGI’s portfolio, with approx. 50% in investment-grade credit , stands out head and shoulders above all of the other funds presented here. It is worth noting that the fund raised its distribution amount twice before the managed distribution strategy was implemented in April 2015. This is also the only fund whose distributions (as of April 2015) contain any significant portion of ROC (“return of capital”) , due to the option overlay strategy used by the managed distribution policy. The percentage of the March 2015 distribution characterized as ROC was 44.5% , according to the fund’s Fact Sheet (p. 3). HHY – Brookfield High Income Fund Inc. Fund sponsor’s website Description: “The Fund seeks high current income by investing in high yield bonds, debentures and other debt instruments.” NAV: (Source: CEF website) Current: $9.25 52-wk. avg.: $9.85 52-wk. high: $10.72 52-wk. low: $9.17 Share price: (Source: CEF website) Current: $8.21 52-wk. avg.: $9.22 52-wk. high: $10.55 52-wk. low: $8.10 Discount/Premium to NAV: (Source: CEF website) Current: -11.24% 52-wk. avg.: -6.48% 52-wk. high: -0.09% 52-wk. low: -12.15% Distribution: (Source: CEF website) Amount (monthly): $0.0750 Yield on market price (current): 10.96% Total Net Assets: $329.692M Effective leverage: 27.76% Total expense ratio: 1.75% YTD return on NAV: 1.77% YTD return on price: -3.02% Avg. daily shares traded: 76,000 Credit ratings of investments: (Source: CEF website) BBB: 4.8% BB: 26.60% B: 44.60% CCC: 13.20% Other + Not Rated: 10.80% Portfolio allocations: (Source: CEF website) Energy: 17.50% Basic Industry: 14.10% Telecommunications: 11.00% Media: 8.80% Leisure: 8.30% Services: 7.20% Healthcare: 7.10% Capital Goods: 5.10% Retail: 4.40% Automotive: 4.20% Summary: This fund has gone through several metamorphoses over the years, and was originally organized under the Morgan Keegan Bond Funds . These went through a very rough patch in 2007, and a lot of investors lost tons of money with them. Essentially, the funds had invested heavily in subprime mortgages, but misled the public to believe that the investments were much less risky corporate bonds and preferred stocks. After the financial crisis, when the Morgan Keegan funds lost most of their value, Brookfield Asset Management, Inc. acquired seven of these funds, salvaged what was left of their assets, and renamed these to make them the Helios family of closed-end funds (source: Maddox Hargett & Caruso ). In July 2014, Brookfield merged, or reorganized, the Helios funds into one single fund, which is HHY – Brookfield High Income Fund Inc. I was invested in one of the Helios funds, HIH , from August 2013 until just before the reorganization in July 2014, when I sold my shares for a nice profit. They raised distributions in December 2013, paid a special dividend, and the discount to NAV, which was around -9% or -10% shortly after the “taper tantrum” in May 2013, had practically disappeared by the time the shares were merged into HHY . I didn’t want to take any chances, so I waited to see what would happen after the reorganization was completed. I waited, and the NAV of HHY continued to decline through the latter half of 2014, along with most other bond funds. The most probable reason was the high allocation to corporate debt in the energy sector. The NAV has been recovering, although not as much as I would like. However, the discount has widened quite a bit, and I am now invested in HHY again. My previous experience with HIH makes me feel comfortable with this fund and its management. Other remarks: Energy asset allocations of HHY are fairly high at 17.5%, and about 24% of its assets have a credit rating of “CCC” or lower. The proportion of assets with “BB” credit rating or better is higher than that of BGH, but lower than those of ISD or GHY. Otherwise, these are my only caveats here. Conclusion The big question remains: Is it time to back up the truck in this sector, or should we wait a little longer to buy at even greater discounts and higher yields? I cannot answer that conclusively, as that would amount to market timing, and basically depends on the individual investor’s risk tolerance. As always, I consider a careful examination of the fundamentals of each fund to be much more important than just looking at yields or discounts. These facts can be found in the annual and semi-annual reports and the fact sheets on the individual websites. After doing the appropriate due diligence, your decisions will depend on the factors most important to your individual investment needs. Of these five funds, ISD and GHY , both funds managed by Prudential Investments LLC , have the largest trading volume, as well as the largest dollar amount of assets ($831.615M and $968.854M, respectively). This makes it much easier to build a position and to eventually unwind it later on, if necessary. Credit ratings of the portfolios are very similar for both funds, and are concentrated within the “BB” and “B” ratings. Both have current yields of slightly less than 10%, but discounts are approximately -12% and -11%, respectively. YTD return on NAV is a respectable 3.68% and 3.85%, respectively. Neither fund has significant exposure to the critical energy sector. BGH ‘s discount to NAV is “only” -9.78%, but has been as narrow as -2.71% in the past year. If market conditions improve, it might be the fastest of these funds to return to a narrower discount or even a premium in the short term. The NAV of BGH has appreciated proportionately higher than the other funds since January. Its discount is less wide than some of the other funds here, but it was much narrower back in January/February than it is now. Still, the yield is over 10%. The biggest caveat with BGH seems to me to be the 20% portfolio allocation in the oil & gas sector right now. A lot will depend on how the energy sector behaves with regard to this fund over the short- and mid-term future. VGI has one of the largest discounts to NAV here, a whopping yield of almost 12%, and the best credit ratings on its portfolio assets of the five funds presented here. How do they do it? Well, look at the fund’s managed distribution policy, which includes a fair portion of ROC (“return of capital”) in the distributions. If we take the distribution amount of $0.1300 from before April 2015, we would still have a yield of “only” 9.92% at today’s market price (the YTD high was on April 7, 2015, at a closing price of $17.26, so back then the yield would have been slightly lower – about 9%), which would still be quite attractive. But the intent of the fund’s management in implementing the option overlay strategy was to make the shares MORE attractive to investors, and as a result, to NARROW the discount. Looking at the chart today, it appears to have had just the opposite effect! NAV has declined a bit since April, so the question one should ask is whether the return of capital (“ROC”) is destructive to NAV, or if it has declined for other reasons. Looking at the chart since January, the discount had actually been narrowing, and it might even be much less today had they not introduced the managed distribution policy. But I think we shall have to wait out another quarter or so if we want to know exactly what is happening right now. The high portfolio credit ratings to me, however, compensate a great deal for any other shortcomings – real or perceived – and therefore, I would not be too hesitant to invest here. But people have differing opinions on what “good ROC” or “bad ROC” is, so your mileage may vary ( Hint: read Douglas Albo’s articles on ROC if you need help in that department, starting with this one and continuing here and here [NOTE: these are from the Fall of 2012, but the underlying theses are still valid] ). Except for VGI, the credit ratings of the four other funds are rather similar to each other, with very small allocations to investment-grade assets, if any, and approximately 50-75% invested in “BB” and “B” securities, and the rest “CCC” or unrated. The two Prudential funds, ISD and GHY, are notable for their lack of energy-related investments. Their assets are also almost all in either “BB” or “B” rated bonds – which is, of course, better than “CCC”, but still not investment-grade credit. HHY has the longest track record of any of the other funds, if you include the period of time when they were known as Helios funds, i.e., starting in 2008-2009 (we won’t talk about the time before that… they were totally different funds back then). It might be worth waiting a little to see whether the discounts and yields increase even more with some of these funds. However, I wouldn’t wait too long, because these funds do have a lot going for them, and I can’t see the discounts widening much more than they already have. Pay attention especially to the NAVs, because eventually, that is what Mr. Market will follow. Disclosure: I am long HHY , have no positions in any of the other funds mentioned here, but am keeping a watchful eye on all of them and might take a position in one or two of the others listed here in the near future, depending on how the NAVs and share prices develop. A lot will depend on how the energy sector does, too, with more than one of the funds substantially invested in that industry. Disclosure: I am/we are long HHY. (More…) I wrote this article myself, and it expresses my own opinions. I am not receiving compensation for it (other than from Seeking Alpha). I have no business relationship with any company whose stock is mentioned in this article.