Scalper1 News
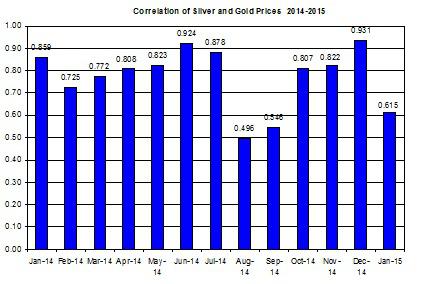
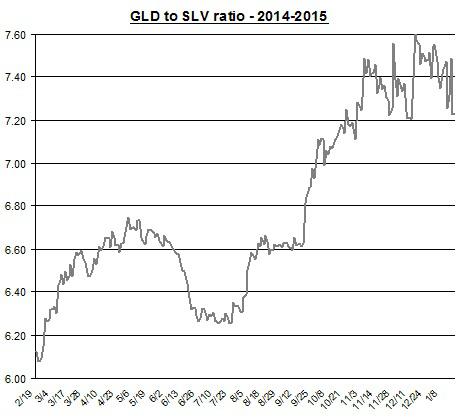
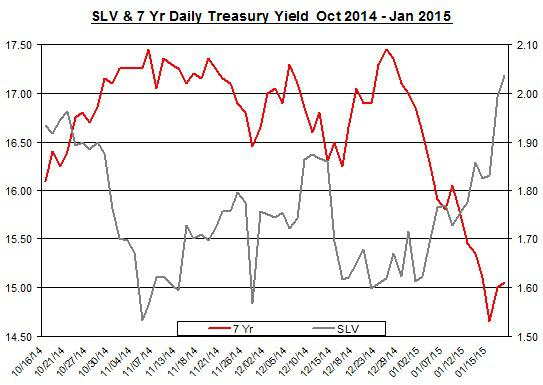
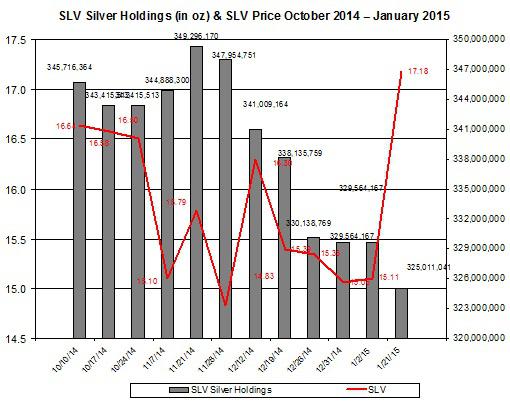 The fall in the U.S. treasuries yields keeps up the price of SLV. The rally of gold is only partly related to the recovery of silver. Despite the recovery in silver prices, SLV’s silver holdings didn’t pick up. The silver market has started off the year on a positive note as shares of iShares Silver Trust (NYSEARCA: SLV ) added nearly 14% to their value (up to date). Is most of this recovery related to the rise in gold? Let’s reexamine the relation between silver and gold and further explore other factors that drive up SLV. Despite the progress of SLV in the past few weeks, its rally seems, at first glance, less related to the rise in gold prices. The chart below shows the linear correlation of gold and silver on a month-to-month basis (daily percent changes). Source: Bloomberg In the past month the linear correlation was around 0.615; even though this is still a significant and strong correlation, it’s also well below the levels recorded in the preceding months. Moreover, the ratio between SPDR Gold Trust (NYSEARCA: GLD ) and SLV has zigzagged with an unclear trend in recent weeks, as indicated in the chart below. Source: Google finance The ratio is still at a high level of around 7.2, which means GLD has still outperformed SLV in the past year. Some investors, however, might consider the high level of the GLD-to-SLV ratio as an indication that the latter is actually cheaper than the former. I put less faith in this assessment. This ratio could keep going up or remain at this level for a long time. After all, back in the early 90s the ratio between gold and silver started off at around 70 – this is the current ratio – and kept rising up to the low 90s and remained in the 70s and 80s range up to 1997. This doesn’t negate the fact that SLV’s recovery in the past few weeks was driven, in part, by the rise in gold. It only goes to show that other factors may have come into play in pushing up silver prices. One other factor to consider is the ongoing drop in long- and mid-term U.S. treasuries yields – they may have also contributed to the rise in SLV prices. The chart below shows the progress in the 7-year U.S. treasury yield and the price of SLV in the past several months. During the period presented below, the linear correlation between the two was around -0.3 – a mid-strong correlation. Source: Bloomberg and U.S Department of the Treasury Even though the FOMC is still expected to raise its interest rates, which are likely to bring back up the U.S. treasury yields in the second half of 2015, the recent developments in the markets including low inflation – mainly due the fall in oil prices – and higher economic uncertainty drove down U.S. treasuries yields. If yields continue to come down in the short term, this could keep pushing up the price of SLV. The recent developments in Europe including the Swiss National Bank’s decision to stop pegging its currency and ECB’s upcoming announcement of its QE program also seem to drive the demand for precious metals. In terms of growth of physical metal, this seems to play a secondary role, at best, in moving the price of silver. After all, China is one of the leading silver importers. The country recently published its fourth-quarter growth rate update; it showed a 7.4% growth in annual terms. This is slightly higher than market expectations of 7.3%. But this is still lower than its growth rate of 7.7%, which was recorded in the same quarter in 2013. This year, the World Bank estimates China’s GDP will expand by only 7.1% – this is 0.4 percentage points below its previous estimate back in June 2014. The IMF also revised down the global economic growth from 3.8% to 3.5% this year. A slower growth rate for China could suggest, at face value, a slower rise in the demand for silver. Lower growth in the world economy isn’t expected to increase the industrial demand for silver but it’s likely to drive more investors towards silver. This only serves as another indication that the demand for silver on paper leads the way for the price of SLV. But is the demand actually picking up for SLV? The chart below presents the changes in SLV’s silver holdings in the past few months. Source: SLV’s website Since the beginning of the year, silver holdings have actually slightly come down by 1.4% to 325 million ounces of silver. This could be an indication that some SLV investors have taken money off the table after the price of silver rallied. Looking forward, however, the recovery of silver is likely to slowly bring more people back to SLV. The silver market has seen a recovery in recent weeks. Over the short term, silver could keep rising especially if the global economy keeps showing slower growth. For more see: 3 Reasons to Prefer Silver Wheaton Scalper1 News
Scalper1 News