Scalper1 News
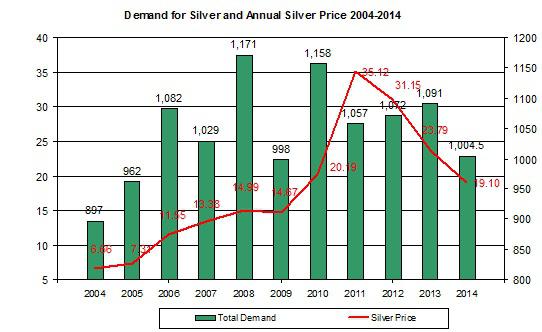
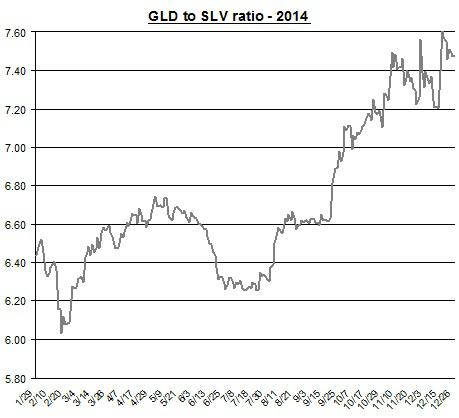
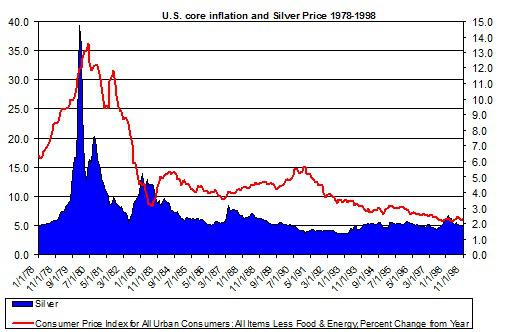
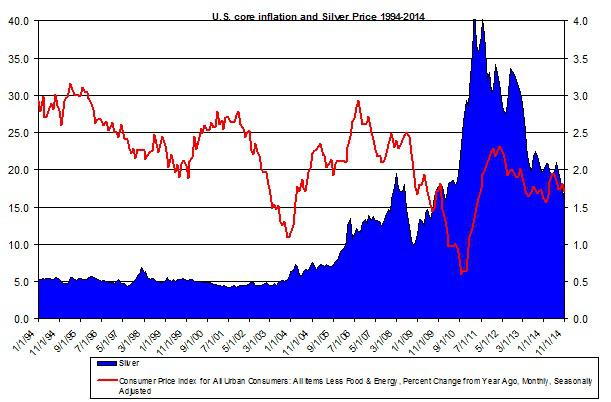 Summary The physical demand for silver has declined in 2014. Even if the demand were to pick up, the price of SLV may keep going down in 2015. The ratio of SLV to GLD gone up in 2014, which means SLV didn’t perform well compared to GLD. This year, the iShares Silver Trust ETF (NYSEARCA: SLV ) didn’t perform well as its price dropped by 18%. The low inflation, the FOMC’s change in policy and the drop in the price of gold contributed to the weakness of silver. Looking forward, even if the physical demand for silver were to pick up, it’s not likely to turn SLV back up. Let’s see why. Physical demand – does it matter? One of the main issues that bullion bulls point out is the changes in the demand for silver that could have an impact on the price of silver and SLV. But I think the changes in the physical demand played a secondary role on the price of SLV in recent years. The chart below presents the changes in demand for silver over the past decade and the average annual price of silver. Source of data Silver Institute and Reuters As you can see, the physical demand for silver seems to have limited impact on the price of SLV in the past few years especially. Back in 2008 the demand for silver reached its highest level in years, and SLV rose over $20, only to fall back by the end of the year to below $9 – so there was a reaction but it didn’t lead to staggering rise in SLV prices. Moreover, the spike in SLV prices during 2011-2012 doesn’t seem to relate to the changes in physical demand for the precious metal. During those years the demand didn’t increase compared to previous years. I also checked the changes in supply during those years — there was no a major shortage for silver on an annual scale more than in previous years. Conversely, even though the demand for silver grew in 2013, the price of SLV came down from its high levels of 2011-2012. Looking forward, HSBC still predicts higher demand for silver in 2015. This is why it retains its forecast price of silver at $17.65 per ounce. China, the world’s largest consumer of silver, will face economic challenges in 2015 – this could suggest China’s demand for silver may not increase any faster than it did in 2014. So the expected rise in physical demand may be harder to achieve next year. The other side of this equation is the changes in supply. In the past decade the supply, which mostly comes from mines, grew at a steady pace. This could change in 2015 as silver producers, which got use to the elevated price of silver over recent years, may taper down their output now that silver prices don’t provide a positive ROI for some of their mines. Such a shift, however, could take time to be reflected silver prices. And in any case, this is likely to be the secondary factor to impact SLV. The main issue is likely to be the changes in the demand for silver on paper, which is mostly driven by silver’s relation to gold, U.S. inflation expectations and treasuries yields. Let’s examine the first two. The issue related to treasuries yield you can see in this past post . This year, SLV has underperformed SPDR Gold Trust (NYSEARCA: GLD ). The relation between the two tended to be very strong and positive for the most part. Source of data: Google finance If GLD continues to remain flat or even slowly comes down, this likely to also bring down the price of SLV. The changes in U.S. inflation also tended to drive higher the price of SLV. The last time the U.S. inflation grew to over 10% was at beginning of the 1980. During that period, the price of silver spiked to around $48 for a very short time before it came back down along with the U.S. inflation. Back then, however, the story behind that spike and crash, which is known as Silver Thursday , was related to the Hunt bothers attempt to corner the silver market. But the rally of silver came even before the Hunt bothers tried to corner the market. Also, gold had a similar rise and fall in the early 80’s. The chart below presents the changes in U.S. core inflation (percent changes from a year back) and price of silver between 1978 and 1998. Source of data: FRED and Bloomberg In the past two decades, however, the U.S. inflation remained relatively flat – below 3%. But silver grew fast in 2011-2012. During those years, although the U.S. inflation remained low, the expectations for a sudden spike in inflation by bullion bulls were high. This is mainly due the FOMC’s policy of implementing its quantitative easing programs in low interest rates environment. Source of data: FRED and Bloomberg In the past few weeks the demand for SLV kept falling down: As of the end of last week, this ETF’s silver holdings have declined by 4% in the last two months. If the demand for silver for investment purposes continues to decrease, this is likely to bring down SLV. The potential fall in supply and expectations for a rise in physical demand may curb down the fall in SLV prices in 2015. But there are other factors that are likely to keep dragging down SLV: As the memories of the Fed’s QE programs remain in the rear view mirror, it becomes harder to see a sudden rise in inflation any time soon. Finally, if gold remains low and inflation doesn’t pick up, SLV isn’t likely to make a comeback in 2015. Scalper1 News
Scalper1 News