Scalper1 News
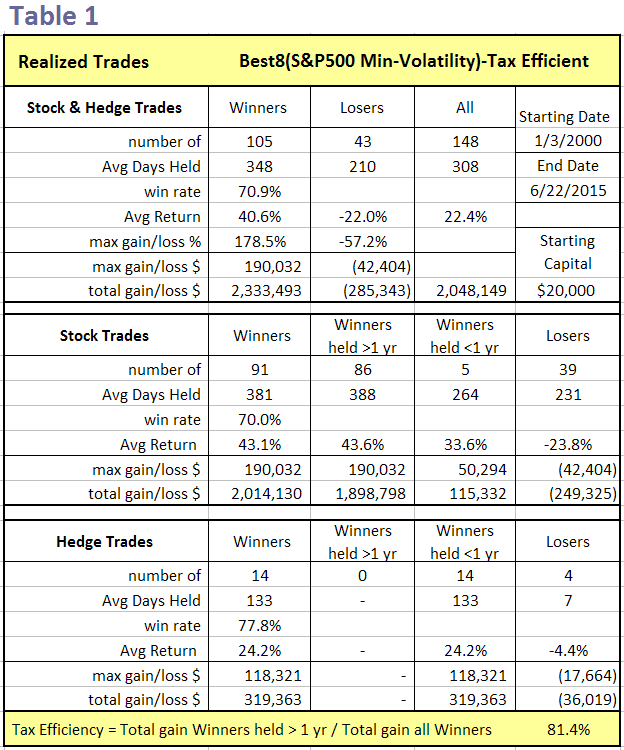
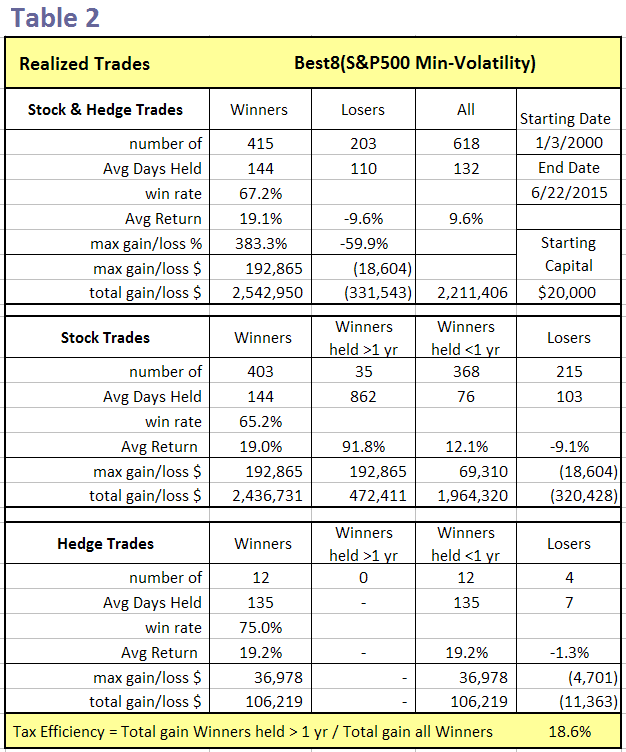
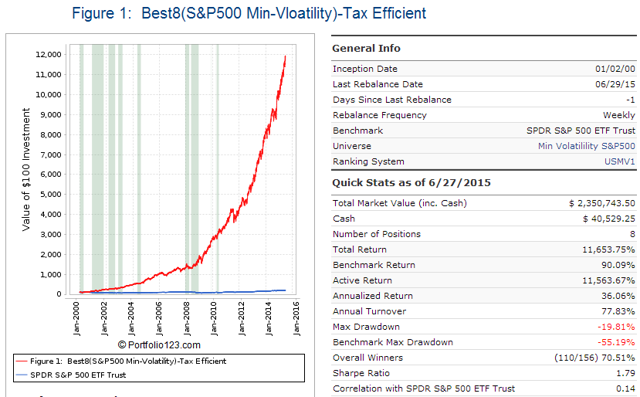
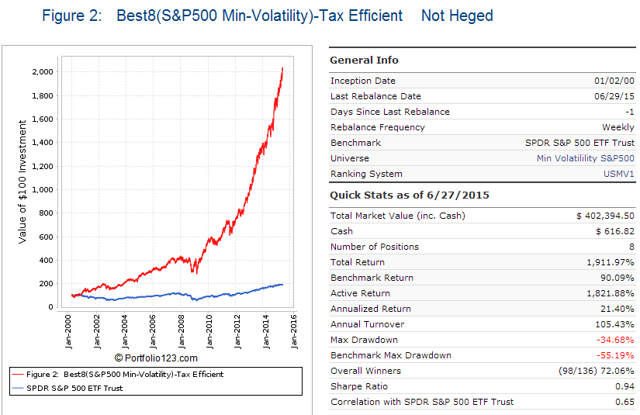
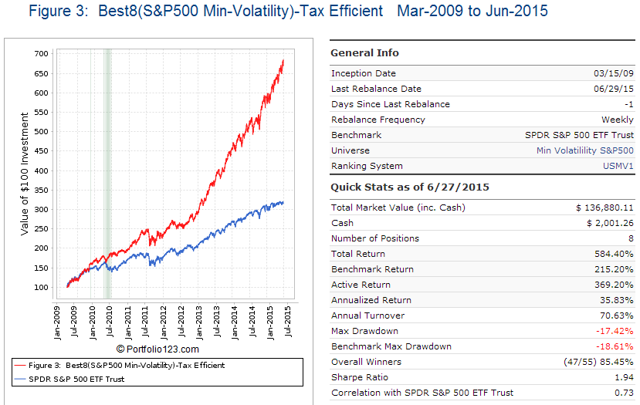
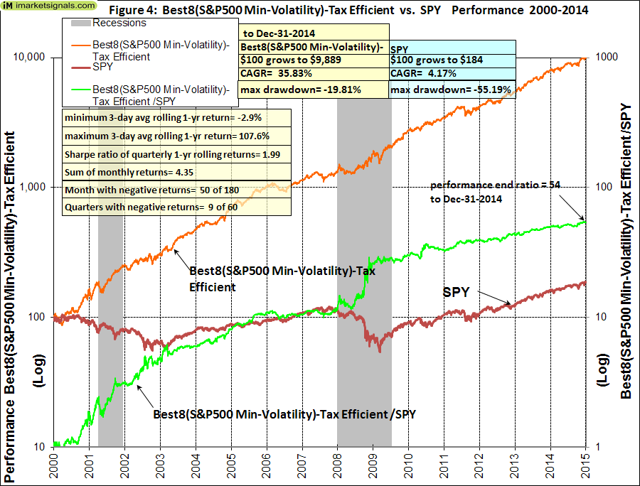
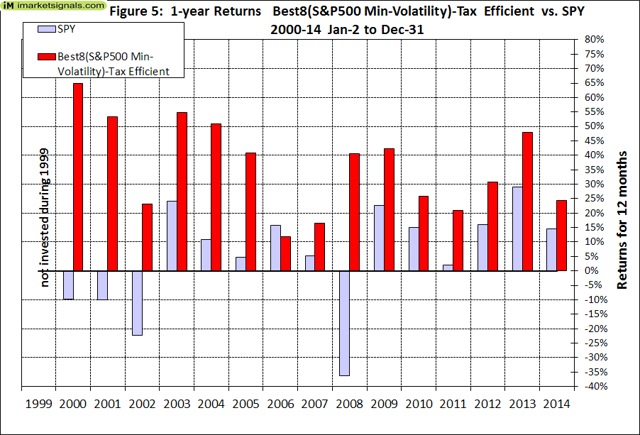
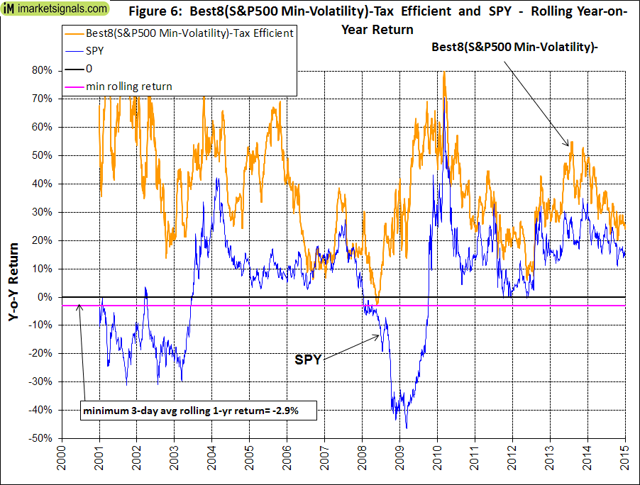
 This model invests periodically in eight highly liquid large-cap stocks selected from those considered to be minimum volatility stocks of S&P 500 Index. Most stock positions are held for longer than one year, resulting in a Tax Efficiency ratio of 81.4%. When adverse stock market conditions exist the model shorts the 3x leveraged Ultra Pro S&P 500 ETF – hedge/current holding ratio= 45%. The model produced a simulated average annual return of about 36% from Jan-2000 to end of June-2015. The Minimum Volatility Stock Universe of the S&P 500 Minimum volatility stocks should exhibit lower drawdowns than the broader market and show reasonable returns over an extended period of time. It was found that a universe of stocks mainly from the Health Care, Consumer Staples and Utilities sectors satisfied those conditions. This minimum volatility universe of the S&P 500 currently holds 117 large-cap stocks (market cap ranging from $4- to $277-billion), and there were 111 stocks in the universe at the inception of the model, on Jan-2-2000. The Best8(S&P 500 Min-Volatility)-US Tax Efficient This model differs from our Best8(S&P500 Min-Volatility) system with regard to the hedge used and additional sell rules to make holding periods mostly longer than one year so that long term capital gain tax rates would apply. Also a position showing a loss greater than 25% may be sold earlier. All other parameters and ranking system are the same. Under some conditions, such as mergers, a stock will be sold and replaced. This may invoking a short term gain for tax purposes if the holding period was less than one year. The model assumes that stocks are bought and sold at the next day’s average of the Low and High price after a signal is generated. Variable slippage accounting for brokerage fees and transaction slippage was taken into account. Tax Efficiency of the Best8(S&P500 Min-Volatility)-US Tax Efficient An analysis of all the realized trades is shown in Table 1. There were 91 winning stock trades of which 86 had holding periods longer than 1 year. All winning hedge trades had holding periods less than 1 year. The Tax Efficiency was defined as the ratio of total $ gains of winners held longer than 1 year to total $ gains of all winners: 81.4% for this model. By comparison, the Tax Efficiency of the Best8(S&P500 Min-Volatility) system which trades frequently was only 18.6% as shown in Table 2. Since both models show the same annualized return of about 36% it would be more advantageous to follow the Tax Efficient system when trading outside a tax-sheltered account. Performance In the figures below the red graph represents the model and the blue graph shows the performance of benchmark the SPDR S&P 500 Trust ETF ( SPY). Figures 1, 2 and 3 show performance comparisons: Figure 1: Performance 2000-2015 and hedging with short the ProShares UltraPro S&P 500 ETF ( UPRO). Annualized Return= 36.1%, Max Drawdown= -19.8%. The model uses a hedge ratio of 45% of current holdings during down-market conditions. (Note: The inception date of UPRO was June 23, 2009. Prior to this date values are “synthetic”, derived from the S&P 500.) Figure 2: Performance 2000-2015 without hedging. Annualized Return= 21.4%, Max Drawdown= -34.7%. The drawdown figure confirms that minimum volatility stocks perform better than the broader market which had a -55% max drawdown. Figure 3: Performance 2009-2015 with hedging. Annualized Return= 35.8%, Max Drawdown= -17.4%. (click to enlarge) (click to enlarge) (click to enlarge) Figures 4 to 8 show performance details: Figure 4: Performance 2000-2014 versus SPY. Over the 15-year period $100 invested at inception would have grown to $9,889, which is 54-times what the same investment in SPY would have produced. Figure 5: 1-year returns. Except for 2006 the 1-year returns were always higher than for SPY. There was never a negative return in one calendar year. Figure 6: 1-year rolling returns. The minimum 1-year rolling return of the 3-day moving average was -2.9% early in 2008. Figure 7: Distribution of monthly returns. One can see that the monthly returns follow a normal distribution, displaced to the right relative to the returns of SPY. Figure 8: Risk measurements for 15-year and trailing 3-year periods. (click to enlarge) (click to enlarge) (click to enlarge) (click to enlarge) Disclaimer One should be aware that all results shown are from a simulation and not from actual trading. They are presented for informational and educational purposes only and shall not be construed as advice to invest in any assets. Out-of-sample performance may be much different. Backtesting results should be interpreted in light of differences between simulated performance and actual trading, and an understanding that past performance is no guarantee of future results. All investors should make investment choices based upon their own analysis of the asset, its expected returns and risks, or consult a financial adviser. The designer of this model is not a registered investment adviser. Scalper1 News
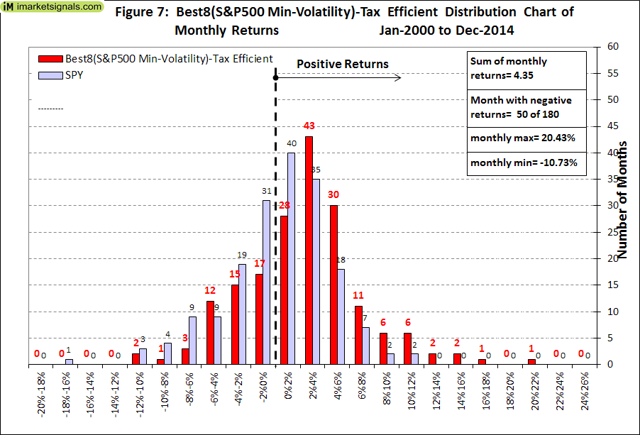
Scalper1 News