Scalper1 News
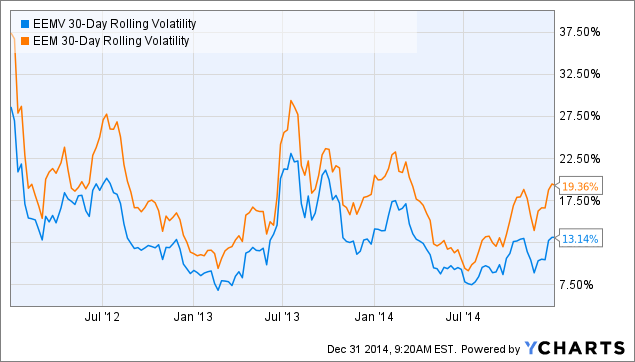
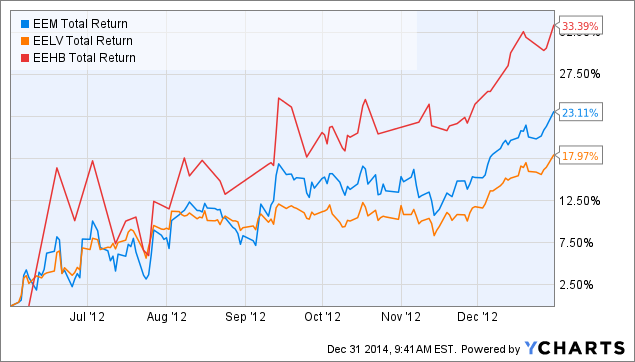
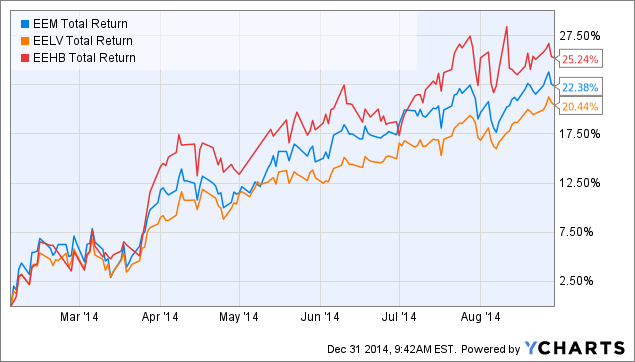
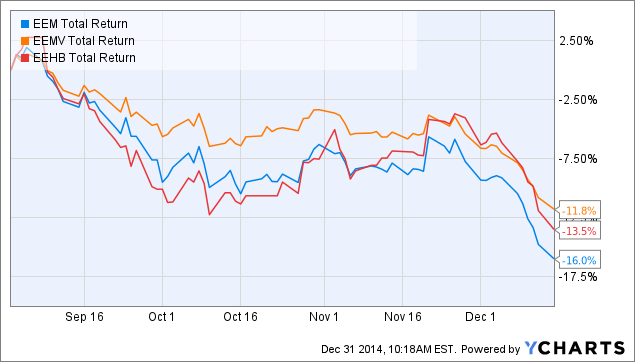 Summary I recently profiled several emerging market low-volatility ETFs and selected EEMV for my own personal portfolio. Last year, another Seeking Alpha author wrote a detailed analysis highlighting the drawbacks of EEMV. This piece considers those drawbacks in light of EEMV’s 3-year performance and also examines the role of the fund in one’s portfolio. Introduction In a previous article , we studied the performance of three low-volatility emerging market (EM) ETFs: EGShares Low Volatility EM Dividend ETF (NYSEARCA: HILO ), PowerShares S&P Emerging Markets Low Volatility Portfolio (NYSEARCA: EELV ) and iShares MSCI Emerging Markets Minimum Volatility (NYSEARCA: EEMV ). We found that all three low-volatility EM ETFs delivered lower volatility than the benchmark iShares MSCI Emerging Markets ETF (NYSEARCA: EEM ) over the past two years, but with wildly disparate returns. EEMV did the best out of the three funds, with a 20.64% return, while EELV returned 8.87%. Also, both funds beat EEM (6.23%). On the other hand, HILO was by far the worst fund with a total return performance of -9.53%. I decided to select EEMV for my own portfolio as it had better sector diversification, greater allocation towards low P/E countries, and the lowest expense ratio out of all the ETFs. In April 2013, around one and a half years after the inception of EEMV, Seeking Alpha author Investment Therapist wrote a detailed analysis that was critical of EEMV for the following four reasons: The methodology of EEMV is constructed without a return focus. Historical volatility is not the best way to obtain low future volatility. EEMV is underdiversified and overconcentrated in low-volatility, high-dividend names, which may underperform in a bull market. The low volatility of EEMV will not protect the fund from a financial crisis. With another 1.5 years under its belt since the date of that article, this fund is now over three years old. This article seeks to address some of the criticisms raised by Investment Therapist in light of the EEMV’s three year performance, and also examines the role of the fund in one’s portfolio. While I disagree with some of his statements, this piece aims not to be combative, but is intended to both clarify my own thinking and to stimulate discussion with the broad readership of Seeking Alpha. 1. The methodology of EEMV is constructed without a return focus. Investment Therapist writes: Basically, the portfolio is being created with an emphasis on volatility and NOT return opportunities. It should go without saying that most rational investors are primarily focused on potential Rewards relative to Risk, and not solely focused on Risk (volatility). By focusing on volatility, the portfolio is created with no outlook on the future return opportunities of the stocks within the portfolio. Investment Therapist is basically saying that volatility has no relationship with future return. However, volatility is a validated factor for alpha. In an April 2012 article by Robeco Asset Management entitled “The volatility effect in emerging markets”, authors Blitz, Pang and Vliet found that from 1988 to 2010, EM stocks that showed lower volatility or lower beta outperformed those with higher volatility or higher beta on a risk-adjusted basis. After adjusting for differences in market beta, the “top-minus-bottom” 1-factor alpha spread between the highest and lowest quintiles of stocks ranked in terms of volatility was determined to be -8.8% per annum. Ranking stocks in terms of beta produced similar results that were less strong (1-factor alpha spread = -5.4%), but still statistically significant. Similar analysis conducted with size, value and momentum (re)confirmed that these premia also operated in emerging markets. Based on the 1-factor alphas, the authors found that the low-volatility premium was much larger than the size premium, comparable to the value premium, but smaller than the momentum premium. Low-volatility stocks also tend to be larger and more mature companies, which could possibly predispose them towards value rather than growth exposure. Was the low volatility premium simply due to an increased exposure to the value factor? To address this, the authors calculated 3-factor and 4-factor alphas for their sample. They found that the 3-factor alphas were very similar to the 1-factor alphas, indicating that exposures to size or value do not explain the higher returns of low-volatility or low-beta stocks in the study. Only the 4-factor alphas were slightly lower, indicating that low-volatility stocks may have indirectly benefited by also showing momentum characteristics (NB: riddle me that!). Therefore, it seems that selecting for low-volatility has been a robust factor for achieving higher risk-adjusted returns. 2. Historical volatility is not the best way to obtain low future volatility. In Robeco’s study of emerging market stocks, the authors stated that “Past risk is again strongly predictive for future risk”. However, Investment Therapist writes: If choosing stocks with low historical volatility and/or low correlations is such a great way of creating a “Minimum Volatility Portfolio,” then why are there over 10 Emerging Market mutual funds that have lower 1-year and Since Inception (of EEMV) volatility than EEMV? Focusing on historical volatility clearly doesn’t produce a portfolio with the lowest volatility. The funds with lower volatility than EEMV focus on the valuation of stocks (determining a stock’s intrinsic value), which EEMV does not since returns are not an input into the construction of the ETF portfolio. Investment Therapist is saying that funds (presumably mutual funds) with a focus on value managed to achieve lower volatility than EEMV over 1-year or since inception (1.5 years). As EEMV is now 3 years old, we can do a longer test of its realized volatility. Note that I shall be using EEM as a benchmark rather than mutual funds as I believe that is a fairer comparison. The graph below shows the 30-day volatility for EEMV and EEM over the past 3 years. EEMV 30-Day Rolling Volatility data by YCharts The results show that EEMV has consistently managed to obtain lower volatility than EEM over the past 3 years. Therefore, it seems that the fund does succeed at producing lower volatility compared to the benchmark. Just for interest, I also report the 2-year volatility and beta values for three EM low-volatility funds (EEMV, EELV and HILO), three EM value funds ( EVAL , PXH , TLTE ), and EEM. The 2-year return of the funds is also shown for comparison. Data are from InvestSpy . Volatility Beta Return EEMV 12.90% 0.81 3.90% EELV 13.30% 0.81 -2.00% HILO 15.30% 0.89 -15.90% Average 13.83% 0.84 -4.67% (NASDAQ: EVAL ) 25.00% 0.57 -5.20% (NYSEARCA: PXH ) 17.90% 1.06 -9.30% (NYSEARCA: TLTE ) 14.70% 0.82 -1.60% Average 19.20% 0.82 -5.37% EEM 16.90% 1.06 -1.40% Interestingly, we find that the three EM value funds actually had higher volatility than the benchmark EEM. Therefore, for passively-managed emerging markets ETFs at least, it seems that value stocks did not possess lower volatilities. 3. EEMV is underdiversified and overconcentrated in low-volatility, high-dividend names, which may underperform in a bull market. Investment Therapist writes: With correlations now coming down and higher yielding investments now approaching the status of “overcrowded trade,” I expect (my opinion) that the same high tracking error that came with the fund on the upside performance will also cause this fund to experience strong pains should a bull market in Emerging Markets form. Overall, once the strong performance over the fund’s very short tenure is examined deeper, it can be seen that the strong stylized bias towards the value-oriented, low-volatility names were a tail-wind to the fund. I do agree with Investment Therapist here. Low-volatility names tend to exist in more mature, stable industries that have a lower capacity for growth. In our previous article, we saw that EEMV was actually more pricey than EEM in terms of its valuation metrics (table reproduced below, data from Morningstar , value metrics are forward-looking). EEMV EEM Price/Earnings 15.69 12.76 Price/Book 1.86 1.49 Price/Sales 1.51 1.14 Price/Cash Flow 7.38 4.91 Dividend yield % 2.81 2.56 Projected Earnings Growth % 10.97 11.76 Historical Earnings Growth % 5.06 -1.68 Sales Growth % -15.60 -13.79 Cash-flow Growth % 6.36 7.85 Book-value Growth % -26.56 -21.57 Since EEMV’s inception, there have been at least two mini-bull markets where EEM climbed by 20% or more. Let’s see how EEMV and its “opposite fund”, the PowerShares S&P Emerging Markets High Beta Portfolio (NYSEARCA: EEHB ), performed over these two time periods. Jun 1st, 2012 to Jan 1st, 2013 EEM Total Return Price data by YCharts Feb 1st, 2014 to Sep 1st, 2014 EEM Total Return Price data by YCharts We can see that in both mini-bull runs, EEMV underperformed the benchmark EEM, while EEHB outperformed. Therefore, I agree with Investment Therapist’s assertion that EEMV would likely underperform EEM in a future bull market. But we should also consider this question: what was the purpose of the low-volatility fund in the first place? No one should have expected such a fund to keep pace with a roaring bull. Instead, a low-volatility fund’s aim should be to reduce equity risk (to a certain extent), resulting in higher risk-adjusted returns. The following table shows the 20-month return, volatility, beta, and maximum drawdown of EEMV, EEHB and EEM (data from InvestSpy ). Volatility Beta Max draw. Return EEMV 13.7% 0.86 -15.90% 7.80% EEHB 25.0% 0.62 -29.90% -12.90% EEM 18.0% 1.16 -18.90% -5.60% We can see that the recent struggles of EM markets has caused EEHB to significantly underperform. EEHB had higher volatility and also greater maximum drawdown over the past 20 months compared to EEMV or EEM. (Note that the beta values are with respect to S&P500 and therefore may n to be applicable). So am I saying to go for high volatility/beta in bull markets, and low volatility/beta in bear markets? Hardly. The first reason is that no one can reliably predict when the next bull or bear market will arrive. The second reason is that if you were to pick a factor to tilt towards in a bull market, wouldn’t you rather choose momentum [such as PowerShares DWA Emerging Market Momentum Portfolio (NYSEARCA: PIE )], which is an academically validated factor for outperformance, rather than high-volatility, an academically validated factor for underperformance? All in all, I don’t think that buying-and-holding EEMV is an inherently flawed decision. This is particularly true for the investor who wants some exposure to emerging markets, but are afraid that they can’t handle the higher volatility of emerging markets. However, for investors with a higher risk tolerance I would recommend also buying PIE and PXH to take advantage of momentum and value premia as well, and for better diversification over the entire market cycle (one could also achieve better diversification by holding EEM). 4. The low volatility of EEMV will not protect the fund from a financial crisis. Investment Therapist writes: Bonds will behave much differently than stocks, even during a financial crisis. A portfolio of stocks, however, wavered during the most recent financial crisis and the lack of “diversification” was made evident. There is no fundamental research proving that this type of optimization would work at the Stock Selection level since a portfolio of stocks behave more similarly than two unique strategies like Bonds and Stocks. I do completely agree with Investment Therapist on this. Low volatility stocks are still stocks, and will move (more or less) as other stocks do. Therefore, investors in EEMV should not expect the fund to hold up during a recession (like a bond would). But again, an investor should be asking the same question: what was the purpose of the low-volatility fund in the first place? What a low-volatility fund will do is to perform better than a neutral or a high-volatility fund during a correction or a bear market. Indeed, (backtested) data shows that MSCI EM Minimum Volatility Index, the underlying index for EEMV, dropped “only” -41.97% in 2008, while the MSCI EM index dropped -53.18%. In more recent and actual data, EEMV held up better than EEM in the September swoon that hit emerging markets this year (strangely, so did EEHB). EEM Total Return Price data by YCharts Conclusion Investment Therapist’s article contained some criticisms on EEMV that, while technically correct, should not unduly worry the investor who recognizes the role and limitations of a low-volatility fund in their portfolio. Yes, EEMV will likely underperform EEM in a bull market and will also likely underperform bonds during a bear market. However, what EEMV will deliver is lower volatility compared to EEM, which is great from a psychological point of view, as well as higher risk-adjusted returns or “alpha” (as long as the low-volatility premium persists, which I will assume to be the case until evidence points otherwise). However, one cautionary note that I will echo Investment Therapist on is that low-volatility stocks are becoming more expensive. Therefore, I recommend that investors with higher risk tolerances should also consider holding EM value funds such as PXH or EM momentum funds such as PIE to harvest other alternative sources of alpha. Scalper1 News
Scalper1 News