Scalper1 News
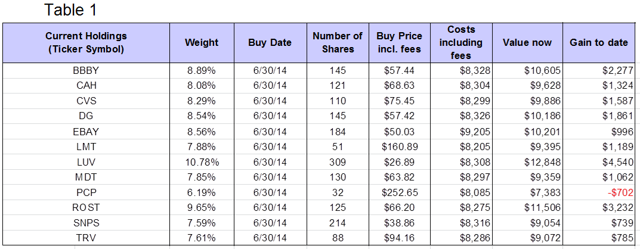
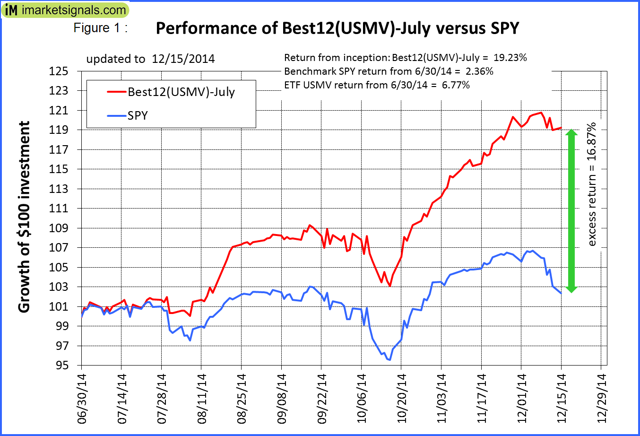
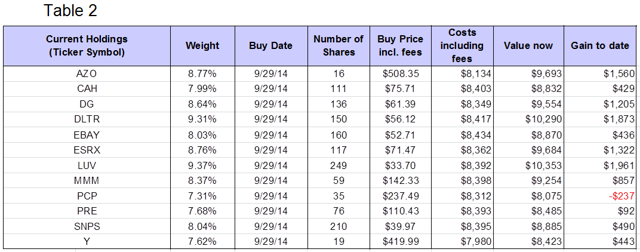
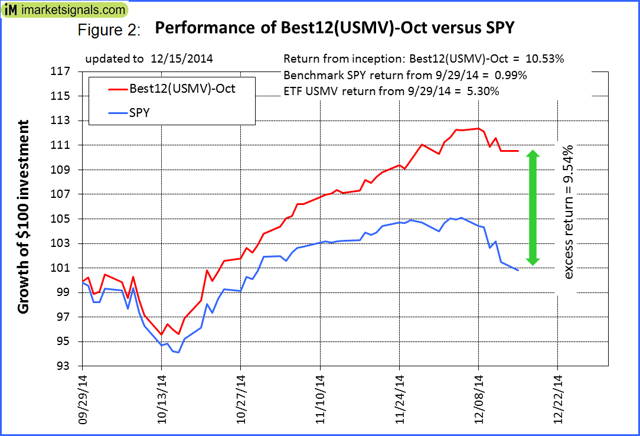 Originally published on Dec. 16, 2014 The backtest reported in this article showed that ranking the holdings of USMV , the iShares MSCI USA Minimum Volatility ETF, and selecting a portfolio of the 12 top ranked stocks, provided higher returns for the buy & hold portfolio than for the underlying ETF. To test these findings out-of-sample we launched the Best12[USMV]-July-2014on Jun-30-2014 and the first sister model Best12[USMV]-Oct-2014 on Sep-29-2014. Holdings and performance have been published weekly on our website since then. So far to Dec-15-2014 these portfolios have gained 19.2% (6.8%) and 10.5% (5.3%), respectively. (USMV gains are in brackets.) The test will be expanded by the launch on Jan-5-2015 of the second of the three sister models quarterly displaced, the Best12[USMV]-Jan-2015, which again will consist of the 12 highest ranked stocks of the then point-in-time holdings of USMV. Eventually there will be four quarterly displaced Best12[USMV] models at iMarketSignals to check whether the out-of-sample [OOS] performances of the models exceed those of USMV over the same periods. Only when the OOS periods are long enough can one decide whether this is a profitable investment strategy. One can probably assume this to be the case if by the end of next year the combined returns of the models are indeed significantly higher than the combined returns of USMV for the corresponding periods. Although the performance of the two models have been considerably better than that of USMV, one should not commit capital in the expectation that strategies that worked well in-sample, and for a few months OOS, are therefore also bound to do well in the future. Backtest Parameters It is relatively simple to “overfit” an investment strategy so that it performs well in-sample, but the more complex a model is, the higher the likelihood of the OOS performance to underperform the backtest’s results. Therefore a simple algorithm with only a few parameters was chosen, with buy- and sell rules kept to a minimum, details of which were provided in the original article. The model should also be tax-efficient because the holding period for each stock will normally be at least one year long. Current Holdings and Return to Dec-15-2014 for Best12[USMV]-July-2014 Of the portfolio’s initial holdings of 12 stocks, 11 of them gained value since inception on Jun-30-14, with the portfolio showing a 19.23% return to Dec-15, while iShares’ USMV gained 6.77% over the same period. A starting capital of $100,000 at inception grew to $119,230, with fees and slippage accounted for. Table 1 below shows the current holdings, unchanged since inception, and return for each position. (click to enlarge) (click to enlarge) The performance graphs of $100 invested in the Best12[USMV] and SPY (the ETF tracking the S&P500), is shown below, with the red graph indicating the value of Best12[USMV]-July-2014 and the blue graph depicting the value of SPY. (click to enlarge) (click to enlarge) Current Holdings and Return to Dec-15-2014 for Best12[USMV]-Oct-2014 Of the portfolio’s initial holdings of 12 stocks, 11 of them gained value since inception on Sep-29-14, with the portfolio showing a 10.53% return to Dec-15, while iShares’ USMV gained 5.30% over the same period. A starting capital of $100,000 at inception grew to $110,530, with fees and slippage accounted for. Table 2 below shows the current holdings, unchanged since inception, and return for each position. (click to enlarge) (click to enlarge) The performance graphs of $100 invested in the Best12[USMV] and SPY (the ETF tracking the S&P500), is shown below, with the red graph indicating the value of Best12[USMV]-July-2014 and the blue graph depicting the value of SPY. (click to enlarge) (click to enlarge) Following the Models At our website, the weekly performance update could be followed already from July 2014 onward. It was originally predicted that a 12-stock model should outperform USMV, which the results of the July and October models so far confirm. (The weekly updates can also be viewed by non-subscribers to iM in the archive section, delayed by a few weeks.) To track performance over an extended OOS period we will be adding, additional to the Jul-2014 and Oct-2014 models, another two similar models, the Jan-2015 and Apr-2015 models. At inception each model will have a 12-stock portfolio selected from the point-in-time holdings of USMV. The universe from which stocks are selected will be updated every three months for each model with the universe corresponding to the then current holdings of USMV. Current holdings of the models, which may not be included in the new universe, will be added to the universe. This will ensure that stocks are not sold because they may be omitted from future holdings of USMV, and the models can keep their holdings for at least one year as stipulated by the sell rules. It is expected that by April 2015 the combined stock holdings of the four models will be about 20% of the holdings of USMV, about 30 different stocks. The portfolio is expected to show better returns than USMV, provided that the OOS performance continuous to confirm the backtest’s results. Appendix Combined Holdings The combined models hold 18 different stocks of which 6 are represented in both models as shown in the table below. Combined Holdings of Best12(NYSEARCA: USMV )-July and Best12( USMV )-Oct Ticker Nr. of times in combination Sector AZO 1 Consumer Discretionary BBBY 1 Consumer Discretionary DG 2 Consumer Discretionary DLTR 1 Consumer Discretionary ROST 1 Consumer Discretionary CVS 1 Consumer Staples PRE 1 Financials TRV 1 Financials Y 1 Financials CAH 2 Health Care ESRX 1 Health Care MDT 1 Health Care LMT 1 Industrials LUV 2 Industrials MMM 1 Industrials PCP 2 Industrials EBAY 2 Information Technology SNPS 2 Information Technology Scalper1 News
Scalper1 News