Scalper1 News
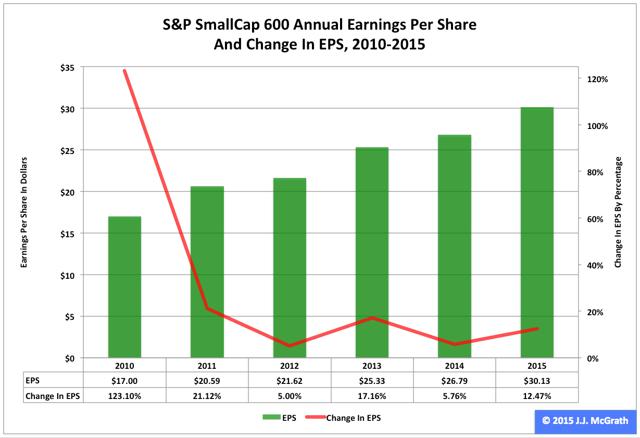
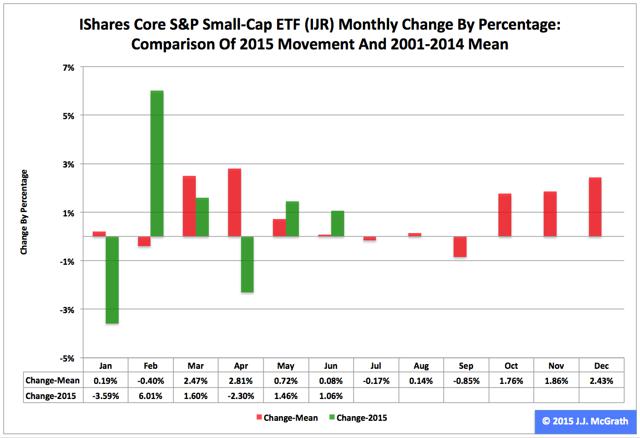
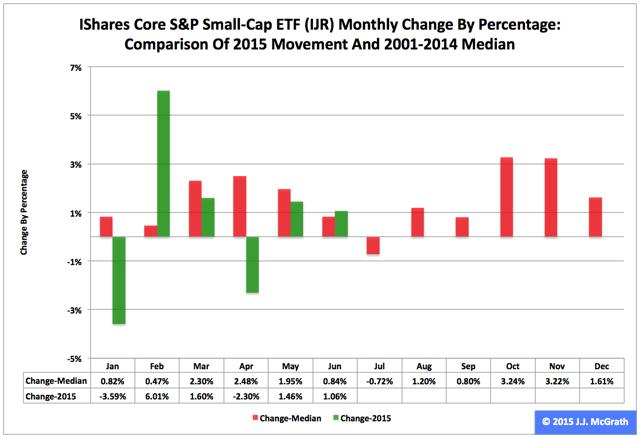 Summary The iShares Core S&P Small-Cap ETF in the first half ranked No. 2 among the three most popular exchange-traded funds based on the S&P Composite 1500’s constituent indexes. In the second quarter, the ETF’s adjusted closing daily share price climbed 0.17 percent. And in June, the fund’s share price rose 1.06 percent. The iShares Core S&P Small-Cap ETF (NYSEARCA: IJR ) during 2015’s first half was second by return among the three most popular ETFs based on the S&P Composite 1500’s constituent indexes: It advanced to $117.88 from $113.33, a gain of $4.55, or 4.02 percent. Over the same period, IJR performed worse than the SPDR S&P MidCap 400 ETF (NYSEARCA: MDY ) by -0.06 percentage point and better than the SPDR S&P 500 ETF (NYSEARCA: SPY ) by 2.91 percentage points. IJR last quarter lagged SPY by -0.06 percentage point and led MDY by 1.29 percentage points. And most recently, IJR last month outpaced MDY and SPY by 2.34 and 3.07 percentage points, respectively. Comparisons of changes by percentages in SPY, MDY, IJR, the small-capitalization iShares Russell 2000 ETF (NYSEARCA: IWM ) and the large-cap PowerShares QQQ (NASDAQ: QQQ ) during the first half, over Q2 and in June can be found in charts published in “SPY’s 2015 2nd-Quarter Performance And Seasonality.” Figure 1: S&P 600 EPS , 2010-2014 Actual And 2015 Projected (click to enlarge) Notes: (1) Estimates are employed for the 2015 data. (2) The EPS scale is on the left, and the change-in-EPS scale is on the right. Source: This J.J.’s Risky Business chart is based on analyses of data in the S&P 500 Earnings and Estimate Report released June 30. IJR may have done OK in the first half, but the ETF might have a hard time doing OK in the second half, with the analysts’ average 2015 earnings-per-share estimate for the S&P 600 index underlying the fund sliding to $30.13 June 30 from $33.60 March 31, as indicated by Howard Silverblatt, senior index analyst at S&P Dow Jones Indices, in the S&P 500 Earnings and Estimate Report series this year (Figure 1). I believe this EPS estimate continues to be unrealistic, as it would require growth of 12.47 percent over last year, so I think there will be more downward revisions in this estimate, which collectively will not constitute an IJR tailwind. In an attempt to put the S&P 600’s valuation in perspective, I calculated the index’s price-to-earnings ratio a couple of different ways based on its closing level of 717.55 Thursday. First I employed its actual EPS of $26.79 in 2014 to produce a P/E ratio of 26.78, and then I used its estimated EPS of $30.13 in 2015 to produce a P/E ratio of 23.82. Because I am a growth-and-value guy who does not anticipate a whole lot of earnings growth this year, I am underwhelmed by this overvaluation, especially at a time when the U.S. Federal Reserve is not expanding its balance sheet by making asset purchases under a quantitative-easing program. Figure 2: IJR Monthly Change, 2015 Vs. 2001-2014 Mean (click to enlarge) Source: This J.J.’s Risky Business chart is based on analyses of adjusted closing monthly share prices at Yahoo Finance . IJR behaved a lot worse in the first half of this year than it did during the comparable periods in its initial 14 full years of existence based on the monthly means calculated by employing data associated with that historical time frame (Figure 2). The same data set shows the average year’s weakest quarter was the third, with a relatively small negative return, and its strongest quarter was the fourth, with an absolutely large positive return. Figure 3: IJR Monthly Change, 2015 Vs. 2001-2014 Median (click to enlarge) Source: This J.J.’s Risky Business chart is based on analyses of adjusted closing monthly share prices at Yahoo Finance. IJR also performed a lot worse in the first half of this year than it did during the comparable periods in its initial 14 full years of existence based on the monthly medians calculated by using data associated with that historical time frame (Figure 3). The same data set shows the average year’s weakest quarter was the third, with a relatively small positive return, and its strongest quarter was the fourth, with an absolutely large positive return. Disclaimer: The opinions expressed herein by the author do not constitute an investment recommendation, and they are unsuitable for employment in the making of investment decisions. The opinions expressed herein address only certain aspects of potential investment in any securities and cannot substitute for comprehensive investment analysis. The opinions expressed herein are based on an incomplete set of information, illustrative in nature, and limited in scope. In addition, the opinions expressed herein reflect the author’s best judgment as of the date of publication, and they are subject to change without notice. Disclosure: I/we have no positions in any stocks mentioned, and no plans to initiate any positions within the next 72 hours. (More…) I wrote this article myself, and it expresses my own opinions. I am not receiving compensation for it (other than from Seeking Alpha). I have no business relationship with any company whose stock is mentioned in this article. Scalper1 News
Scalper1 News