Tag Archives: nysearcamdy

The Low Volatility Anomaly: Mid Caps

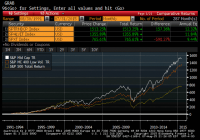
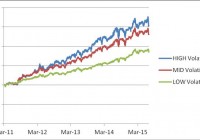
The Low Volatility Anomaly describes portfolios of lower volatility securities that have produced higher risk-adjusted returns than higher volatility securities historically. This article provides additional evidence for Low Volatility strategies by showing the factor’s success in mid-cap stocks. Provides historical comparison of returns between low volatility mid cap stocks versus broad mid cap indices and the benchmark large cap index. Thus far in this series, our most oft used description of the Low Volatility Anomaly in equity markets has been depicted through the use of a factor tilt on a large cap index. In the introductory article to this series on Low Volatility Investing, I plotted the cumulative total return profile (including reinvested dividends) of the S&P 500 (NYSEARCA: SPY ), the S&P 500 Low Volatility Index (NYSEARCA: SPLV ), and the S&P 500 High Beta Index (NYSEARCA: SPHB ) over the past twenty-five years. In an article last week , I showed that the Low Volatility Anomaly extends to small cap stocks as well as the S&P Smallcap 600 Low Volatility Index has also outperformed the broader S&P Smallcap 600 over the last twenty years, producing annual total returns of nearly 14% per annum. The volatility-tilted indices for both the small and large cap indices are comprised of the twenty percent of index constituents with the lowest (highest) volatility within the S&P 500 based on daily price variability over the trailing one year, rebalanced quarterly, and weighted by inverse (direct) volatility. The low volatility tilt of both the small and large cap indices produced both higher absolute returns and much lower variability of returns than the broader market gauges. This article will answer the question of whether such a factor tilt delivers alpha in the space in-between – the mid-cap stock market. Fortunately for our examination, Standard & Poor’s has also developed the S&P MidCap 400 Low Volatility Index . Similar to the S&P 500 Low Volatility Index, this benchmark tracks the twenty percent of the S&P MidCap 400 (eighty stocks) with the lowest realized volatility over the past year, weighted by an inverse of that volatility, and then rebalanced quarterly. While the index was launched in September 2012, Standard & Poor’s has back-tested data for over twenty years. Below is a graph of the cumulative total return of the S&P MidCap 400 Low Volatility Index, the S&P MidCap 400 Index, and the S&P 500. (click to enlarge) Source: Standard and Poor’s; Bloomberg As you can see above, the S&P MidCap 400 Index (white line; replicated through the ETF MDY ) readily bests the S&P 500 (yellow line). This outperformance is consistent with my article on 5 Ways to Beat the Market that demonstrated the structural alpha available through the size factor, which has been well documented in academic research (F ama & French, 1992 ). Some readers have also contended that the outperformance from Equal Weighting, which was also one of my “5 Ways ” is attributable to the size factor as well and more reminiscent of a mid-cap strategy given the lower average capitalization of equally weighting versus traditional capitalization weighting, but I contend that the contrarian re-balancing also contributes to the alpha-generative nature of that strategy. Whatever the source of the structural alpha, mid-caps have outperformed large-caps over long-time intervals. Low Volatility mid-caps have outperformed the broad mid-cap index on a risk-adjusted basis, but not on an absolute basis like the Small and Large Cap strategies. In tabular form, one can readily see that each of the small cap, mid cap, and large cap Low Volatility indices produce higher risk-adjusted returns with lower variability of returns than the broader market gauges from which they are constructed. The lower downside in the market selloff in 2008 greatly contributes to the lower variability of the Low Volatility indices. (click to enlarge) The PowerShares S&P MidCap Low Volatility Portfolio (NYSEARCA: XMLV ) seeks to replicate the performance of the S&P MidCap 400 Low Volatility Index with a 0.25% expense ratio. Like many of the Low Volatility ETFs, XMLV is a post-crisis innovation with a track record dating only back to February 2013. The ETF has only $100M of AUM, and thirty-day average volume of only 14,600 shares, similar AUM to the SmallCap Low Volatility ETF (NYSEARCA: XSLV ), but about 2/3 of the trading volume. Again similar to the Small Cap Low Volatility Index, I would be remiss if I did not mention that financials currently account for nearly half of the fund weighting (REITs 27.3%, Insurance 16.6%, Banks 3.8%). As I covered in a recent comparison between the PowerShares S&P Low Volatility ETF versus the iShares MSCI USA Minimum Volatility ETF (NYSEARCA: USMV ), industry concentrations in the S&P indices are uncapped, unlike the MSCI versions, and this lack of constraints has historically led to risk-adjusted outperformance and more variable industry concentrations over time. A reader of my article on Small Cap Low Volatility contended that they disfavored these funds because of the potential higher sensitivity to higher rates given the financial bent. Rates are moderately higher in 2015, and XMLV has delivered market-beating returns. I would point out that if higher rates lead to higher return volatility, then these stocks will be attributed lower weights or excluded from the fund at the quarterly rebalance date. As described in now fourteen recent articles on the Low Volatility Anomaly, I am a believer in the relative risk-adjusted outperformance of low volatility strategies. While Mid-Cap Low Volatility did not deliver the absolute outperformance versus the Mid Cap Index over the historical sample period, it still strongly outpeformed on a risk-adjusted basis. Versus the S&P 500, which many use as their benchmark, MidCap Low Volatility still delivered 3% per annum of outperformance with less than three-quarters of the return volatility. I am also a believer in the long-run outperformance available through the size factor that favors smaller and mid-capitalization stocks. Resultantly, I am evaluating an entry into a modest position to XMLV to provide some additional diversification to the Low Volatility portion of my long-term portfolio and will monitor the efficacy of this ETF vehicle as it matures. Disclaimer: My articles may contain statements and projections that are forward-looking in nature, and therefore inherently subject to numerous risks, uncertainties and assumptions. While my articles focus on generating long-term risk-adjusted returns, investment decisions necessarily involve the risk of loss of principal. Individual investor circumstances vary significantly, and information gleaned from my articles should be applied to your own unique investment situation, objectives, risk tolerance, and investment horizon Disclosure: I am/we are long SPY, SPLV, XSLV. (More…) I wrote this article myself, and it expresses my own opinions. I am not receiving compensation for it (other than from Seeking Alpha). I have no business relationship with any company whose stock is mentioned in this article.

Adding XIV, Inverse Volatility ETF, Enhances The Performance Of A Stocks And Bonds Portfolio

Summary A hypothetical portfolio composed of MDY, QQQ, SHY and TLT performed quite well since its inception in 2003, even during the bear market of 2008-09 and the 2011 market correction. Adding XIV to the portfolio increases the performance range significantly. The enhanced portfolio performed well during the 2011 market correction. In this article we investigate the effect of adding a volatility component to a portfolio of stock and bond ETFs that is known to perform well during market downtrends. We decided to add the VelocityShares Daily Inverse VIX Short-Term ETN (NASDAQ: XIV ), a fund initiated on 11/29/2010. Since XIV historical price data is available only from December 2010 on, and we need 65 trading days for estimating market parameters, we were able to simulate our optimal allocation strategy starting with March 2011. We performed an analysis of the difference in performance of the basic and enhanced portfolios over a 52 months period. Here is the composition of the volatility enhanced portfolio: SPDR S&P Mid-Cap 400 ETF Trust (NYSEARCA: MDY ) PowerShares QQQ Trust ETF (NASDAQ: QQQ ) iShares 1-3 Year Treasury Bond ETF (NYSEARCA: SHY ) iShares 20+ Year Treasury Bond ETF (NYSEARCA: TLT ) VelocityShares Daily Inverse VIX Short-Term ETN ( XIV ) Basic information about the funds was extracted from Yahoo Finance and is shown in table 1. Table 1. Symbol Inception Date Net Assets Yield Category MDY 5/4/1995 17.04B 1.08% Mid-Cap Blend QQQ 3/31/1999 45B 1.01% Technology Large-Cap SHY 7/22/2002 9.17B 0.42% Short Term Treasury Bond TLT 7/22/2002 17.04B 2.70% Long Term Treasury Bond XIV 11/29/2010 497M 0.00% Inverse Volatility The data for the study were downloaded from Yahoo Finance on the Historical Prices menu for MDY, QQQ, SHY, TLT, XIV. We use the daily price data adjusted for dividend payments. The portfolio is managed as dictated by a variance-return optimization algorithm developed on the Modern Portfolio Theory (Markowitz). The allocation is rebalanced monthly at market closing of the first trading day of the month. The optimization algorithm seeks to maximize the return under a constraint on the portfolio risk determined as the standard deviation of daily returns. In table 2 we list the total return, the compound average growth rate (CAGR%), the maximum drawdown (maxDD%), the annual volatility (VOL%), the Sharpe ratio and the Sortino ratio of the volatility enhanced portfolio. We simulated the performance of the portfolio under three targets of the volatility of the returns: low, mid and high. Table 2. Performance of the volatility enhanced portfolio from March 2010 to June 2015   TotRet CAGR NO.trades maxDD VOL Sharpe Sortino LOW risk 84.84% 15.26% 52 -6.90% 9.71% 1.57 2.04 MID risk 130.38% 21.28% 50 -9.83% 13.93% 1.53 2.03 HIGH risk 152.63% 23.89% 50 -12.56% 17.06% 1.40 1.82 SPY 71.93% 13.35% 0 -18.61% 15.15% 0.88 1.11 In figure 1 we show the equity curves for the portfolio with the three targets of the volatility. (click to enlarge) Figure 1. Equity curves for the volatility enhanced portfolio adaptively optimized with a low, mid, and high volatility constraint. Source: This chart is based on calculations using the adjusted daily closing share prices of securities. We also simulated the optimal allocation for maximizing the return without any volatility constraints. The results for the basic portfolio (MDY+QQQ+SHY+TLT) and the volatility enhanced portfolio (same ETFs + XIV), are shown in table 3. Table 3. Performance of portfolios optimized for maximum return without volatility constraints.   TotRet CAGR NO.trades maxDD VOL Sharpe Sortino Basic 113.00% 19.10% 16 -13.83% 15.10% 1.27 1.84 Enhanced 462.22% 49.06% 15 -39.00% 46.53% 1.05 1.22 The equity curves of the portfolios are shown in figure 2. (click to enlarge) Figure 2. Equity curves for the basic and the volatility enhanced portfolio optimized for maximum return without any volatility constraints. Source: This chart is based on calculations using the adjusted daily closing share prices of securities. As can be seen from table 3 and figure 2, the enhanced portfolio can achieve extremely high returns. Those high returns come with a high increase of the volatility of the returns. This behavior is not surprising, given the high volatility of the XIV fund. Fortunately, the XIV fund accumulates gains due to its daily rebalancing while the VIX futures are in contango because it buys the cheaper current month VIX future and it sells the more expensive next month VIX future. Of course, the rebalancing causes losses while the VIX futures are in backwardation. We compared the returns of the portfolios over the bear market of 2008, and the market corrections of 2010 and 2011. The results are shown in table 4. Table 4 Total returns of the portfolios during market downturns Time Period SPY Basic Port. Enhanced Port. 4/2011 – 9/2011 -16.22% 15.09% 11.12% As seen in table 4 both the basic and the enhanced portfolios were profitable during the 2011 market correction. We know that the basic portfolio was profitable during the 2008-09 bear market. We expect that the enhanced portfolio would also perform well, but we do not have historical data to verify it. Conclusion By adding a volatility based fund to a portfolio of stock and bond funds, we obtained a portfolio that is capable of delivering exceptionally high returns during stock bull markets. By allocating the funds based on a return-variance optimization algorithm with volatility constraints, one can achieve high returns with limited down risk during market corrections. Additional disclosure: The article was written for educational purposes and should not be considered as specific investment advice. Disclosure: I am/we are long QQQ,SHY. (More…) I wrote this article myself, and it expresses my own opinions. I am not receiving compensation for it (other than from Seeking Alpha). I have no business relationship with any company whose stock is mentioned in this article.

The SPDR S&P MidCap 400 ETF: Let’s Analyze It Using Our Scorecard System

Summary Analysis of the components of the SPDR S&P MidCap 400 ETF using my Scorecard System. Specifically written to assist those Seeking Alpha readers who are using my free cash flow system. Compares the results of the SPDR S&P MidCap 400 ETF to the SPDR S&P 600 Small Cap ETF and the SPDR S&P 500 ETF. Back in late December I introduced my free cash flow “Scorecard” system here on Seeking Alpha, through a series of articles that you can view by going to my SA profile . My purpose in doing so was to try and teach as many investors as I could, how to do this simple analysis on their own as I believe in the following: “Give a person a fish and you feed them for a day, Teach a person to fish and you feed them for life” I have been very pleased with the positive feedback that I have received so far, but included in that feedback were many requests by those using my system, to see if they did their analysis correctly or not. Since the rate of these requests have been increasing with every new article I write, I decided to concentrate my attention on articles analyzing indices and industry ETFs covering a broad range of sectors. That way those of you using my system will have something like a “teacher’s edition” that will give you all the correct calculations for each component. Obviously I couldn’t include the financials used to create the results for all my ratios (as I would need to write you a book instead), so instead I will provide just my Scorecard results for each index or ETF and then let everyone go back and analyze each company and see if you get the same answers that I did. My data source will always be Y-Charts . I designed this system for the newbie investor, whom may have limited knowledge of investing, and assure them that with just a little effort, anyone can master the system I have presented here. As I write more articles, my hope in doing so is that everyone will be able to follow my work and then go investigate the stocks that seem interesting to them. Think of this project as sort of like the game show “JEOPARDY”, where I give you the final answers and then you go figure out the questions. Hopefully these articles can be used as reference guides that everyone can use over and over again, whenever the need arises. Again this analysis will just be my final Scorecard for the SPDR S&P MidCap 400 ETF (NYSEARCA: MDY ) and for those new to this analysis, I suggest that you read my introductory Scorecard article on the SPDR S&P 500 ETF (NYSEARCA: SPY ) by going HERE . That article will send you HERE . There you will find the data on my “Free Cash Flow Yield” ratio which is one of three parts that I use it tabulating my final “Scorecard”. While free cash flow yield is a Wall Street ratio (Valuation Ratio), I also wrote an article that concentrated on my “CapFlow” and “FROIC” Ratios, which are Main Street ratios, which you can read about by going HERE . In this article I will generate my Scorecard results for each component and basically combine all three ratio results to generate one final result. Once completed, my Scorecard should give everyone a clearer understanding on how accurate the valuation is that Wall Street has assigned each company relative to its actual Main Street performance. Before we show you the final results of my Scorecard, here is brief introduction to how it works: Scorecard The Scorecard is the final score for any company under analysis and this is done by combining the three ratio (listed below) final results into one analysis, we grade each company with either a passing score of 1 or a failing score of 0 per ratio where a perfect final score per stock would be a 3. The ideal CapFlow results are anything less than 33%. The ideal FROIC score is any result above 20%. The ideal Free Cash Flow Yield is anything over 10%. So in analyzing Apple (NASDAQ: AAPL ) for example, we get for TTM (trailing twelve months). For the conservative investor: CAPFLOW = 16% PASSED FROIC = 34% PASSED FREE CASH FLOW YIELD = 7.6% FAILED SCORECARD SCORE = 2 (Out of possible 3) For the aggressive or “Buy & Hold” investor, we get a Scorecard score of 3 as Apple’s 7.6% free cash flow yield would be classified as a buy. These are the parameters for the Free Cash Flow Yield. It is important before preceding to determine what kind of investor you are as determined by the amount of risk you are willing to take. Then once you have done that, then pick the parameter list below that fits your risk tolerance. So without further ado here are the final Scorecard results for the components that make up the SPDR S&P MidCap 400 ETF. What my Scorecard also achieves, besides telling you which individual stocks are attractive and which are not, is that it also allows you in “one shot” to see how overvalued or attractively valued the stock market is as a whole. For example, for the conservative investor now is the time to be extremely cautious as only these thirteen stocks came in with a perfect score of “3” As you can see I only found 13 bargains out of 400 for the conservative low risk investor and that comes out to just 3.3% of the total universe being bargains! As for the aggressive investor, who is willing to take on more risk, we have only 33 stocks that are considered higher risk bargains. That comes out to only 8.3% being attractive and 91.7% being holds or sells. So as you can see as a portfolio manager I have to work extremely hard just to find one needle in the haystack, while in March 2009 there were probably 200 bargains for the conservative investor at that time. Thus this data clearly shows that we are at the opposite extreme of where we were in 2009 and are in my opinion, at an extremely overvalued level. Here is the same analysis using the Dow Jones Index where I actually analyzed that index for 2001, 2009 and 2015. You can view those results by going HERE . In getting back to the main table above, the “TOTALS” you see at the end are the sum of each ratio divided by 400. The totals for both Scorecards are out of 1200 (1 point for each ratio result) as a perfect score were every stock would be a bargain. Therefore the conservative scorecard result is 482/1200 or 40.16% out of 100% and the more aggressive/buy & hold scorecard came in at 614/1200 or 51.16% out of 100%. The beauty of this system is that you can now compare this index result to any other index or ETF in juxtaposition. For example the S&P 500 Index for the conservative scorecard result is 384/1500 or 25.6% out of 100% and the more aggressive/buy & hold scorecard came in at 488/1500 or 32.5% out of 100%. The SPDR S&P 600 Small Cap ETF (NYSEARCA: SLY ) came in for the conservative scorecard at 374/1800 or 20.77% out of 100% and the more aggressive/buy & hold scorecard came in at 476/1800 or 26.44% out of 100%. All three are clearly not inspiring and could be a clear sign that the markets are ready for serious correction going forward, while the MidCap is far more attractive than the S&P 500 and 600 and that is where I am concentrating most of my attention. Always remember that the results shown above should not be considered investment advice, but just the results of the ratios. The system outlined in this article is just meant to be used as reference material to be included as just “one” part of everyone’s own due diligence. So in other words, don’t make investment decisions based on just my Scorecard results, but incorporate them as part of your own due diligence.