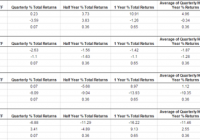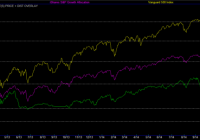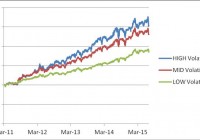
Summary A hypothetical portfolio composed of MDY, QQQ, SHY and TLT performed quite well since its inception in 2003, even during the bear market of 2008-09 and the 2011 market correction. Adding XIV to the portfolio increases the performance range significantly. The enhanced portfolio performed well during the 2011 market correction. In this article we investigate the effect of adding a volatility component to a portfolio of stock and bond ETFs that is known to perform well during market downtrends. We decided to add the VelocityShares Daily Inverse VIX Short-Term ETN (NASDAQ: XIV ), a fund initiated on 11/29/2010. Since XIV historical price data is available only from December 2010 on, and we need 65 trading days for estimating market parameters, we were able to simulate our optimal allocation strategy starting with March 2011. We performed an analysis of the difference in performance of the basic and enhanced portfolios over a 52 months period. Here is the composition of the volatility enhanced portfolio: SPDR S&P Mid-Cap 400 ETF Trust (NYSEARCA: MDY ) PowerShares QQQ Trust ETF (NASDAQ: QQQ ) iShares 1-3 Year Treasury Bond ETF (NYSEARCA: SHY ) iShares 20+ Year Treasury Bond ETF (NYSEARCA: TLT ) VelocityShares Daily Inverse VIX Short-Term ETN ( XIV ) Basic information about the funds was extracted from Yahoo Finance and is shown in table 1. Table 1. Symbol Inception Date Net Assets Yield Category MDY 5/4/1995 17.04B 1.08% Mid-Cap Blend QQQ 3/31/1999 45B 1.01% Technology Large-Cap SHY 7/22/2002 9.17B 0.42% Short Term Treasury Bond TLT 7/22/2002 17.04B 2.70% Long Term Treasury Bond XIV 11/29/2010 497M 0.00% Inverse Volatility The data for the study were downloaded from Yahoo Finance on the Historical Prices menu for MDY, QQQ, SHY, TLT, XIV. We use the daily price data adjusted for dividend payments. The portfolio is managed as dictated by a variance-return optimization algorithm developed on the Modern Portfolio Theory (Markowitz). The allocation is rebalanced monthly at market closing of the first trading day of the month. The optimization algorithm seeks to maximize the return under a constraint on the portfolio risk determined as the standard deviation of daily returns. In table 2 we list the total return, the compound average growth rate (CAGR%), the maximum drawdown (maxDD%), the annual volatility (VOL%), the Sharpe ratio and the Sortino ratio of the volatility enhanced portfolio. We simulated the performance of the portfolio under three targets of the volatility of the returns: low, mid and high. Table 2. Performance of the volatility enhanced portfolio from March 2010 to June 2015 TotRet CAGR NO.trades maxDD VOL Sharpe Sortino LOW risk 84.84% 15.26% 52 -6.90% 9.71% 1.57 2.04 MID risk 130.38% 21.28% 50 -9.83% 13.93% 1.53 2.03 HIGH risk 152.63% 23.89% 50 -12.56% 17.06% 1.40 1.82 SPY 71.93% 13.35% 0 -18.61% 15.15% 0.88 1.11 In figure 1 we show the equity curves for the portfolio with the three targets of the volatility. (click to enlarge) Figure 1. Equity curves for the volatility enhanced portfolio adaptively optimized with a low, mid, and high volatility constraint. Source: This chart is based on calculations using the adjusted daily closing share prices of securities. We also simulated the optimal allocation for maximizing the return without any volatility constraints. The results for the basic portfolio (MDY+QQQ+SHY+TLT) and the volatility enhanced portfolio (same ETFs + XIV), are shown in table 3. Table 3. Performance of portfolios optimized for maximum return without volatility constraints. TotRet CAGR NO.trades maxDD VOL Sharpe Sortino Basic 113.00% 19.10% 16 -13.83% 15.10% 1.27 1.84 Enhanced 462.22% 49.06% 15 -39.00% 46.53% 1.05 1.22 The equity curves of the portfolios are shown in figure 2. (click to enlarge) Figure 2. Equity curves for the basic and the volatility enhanced portfolio optimized for maximum return without any volatility constraints. Source: This chart is based on calculations using the adjusted daily closing share prices of securities. As can be seen from table 3 and figure 2, the enhanced portfolio can achieve extremely high returns. Those high returns come with a high increase of the volatility of the returns. This behavior is not surprising, given the high volatility of the XIV fund. Fortunately, the XIV fund accumulates gains due to its daily rebalancing while the VIX futures are in contango because it buys the cheaper current month VIX future and it sells the more expensive next month VIX future. Of course, the rebalancing causes losses while the VIX futures are in backwardation. We compared the returns of the portfolios over the bear market of 2008, and the market corrections of 2010 and 2011. The results are shown in table 4. Table 4 Total returns of the portfolios during market downturns Time Period SPY Basic Port. Enhanced Port. 4/2011 – 9/2011 -16.22% 15.09% 11.12% As seen in table 4 both the basic and the enhanced portfolios were profitable during the 2011 market correction. We know that the basic portfolio was profitable during the 2008-09 bear market. We expect that the enhanced portfolio would also perform well, but we do not have historical data to verify it. Conclusion By adding a volatility based fund to a portfolio of stock and bond funds, we obtained a portfolio that is capable of delivering exceptionally high returns during stock bull markets. By allocating the funds based on a return-variance optimization algorithm with volatility constraints, one can achieve high returns with limited down risk during market corrections. Additional disclosure: The article was written for educational purposes and should not be considered as specific investment advice. Disclosure: I am/we are long QQQ,SHY. (More…) I wrote this article myself, and it expresses my own opinions. I am not receiving compensation for it (other than from Seeking Alpha). I have no business relationship with any company whose stock is mentioned in this article.