Tag Archives: transactionname

Estimating Worst Case SWRs For Modern Portfolios

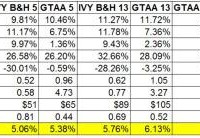
One of the challenges in dealing with modern portfolios like the Permanent Portfolio, the various IVY portfolios, Risk Parity portfolios, etc is the lack of long term historical data. Most of the modern portfolio data for a broad range of asset classes only goes back to 1973. The period from 1973 onward obviously only represents a subset of historical economic and financial conditions. This represents quite a challenge when looking forward and trying to model probable future outcomes for different portfolios. In the context of retirement this fact makes determining SWRs for modern portfolios difficult. The worst case historical 30 year retirement period that determines the SWR for the 60/40 US stock US bond portfolio began in 1966 . Fortunately, 1966 is not that far from 1973 which gave me an idea for estimating SWRs for modern portfolios as if they existed from 1966. Just use the 60/40 return data to for the modern portfolios from 1966 to 1972, then the modern portfolio return data going forward to estimate an SWR for these portfolios. This should give a conservative estimate for historical SWRs form these portfolios which is an apples to apples comparison to the SWR from the classic 60/40 portfolio, aka the famous 4% rule. Let’s see where this process takes us. In previous posts I had presented a variety of statistics for modern portfolios; returns, standard deviations, and SWRs. I also pointed out that the SWRs from these calculations had to be taken with a huge grain of salt. The retirement periods from 1973 onward, when the data for the modern portfolios begins, do not encompass the worst case period in history to retire, the 30 year period starting in 1966. The SWRs for periods starting in 1973 would be significantly higher than for those starting in 1966. In order to get an estimate of what SWRs for modern portfolios would have been going back to 1966 I simply took the historical return series for each of the modern portfolios and used the return data from the 60/40 portfolio from 1966 to 1972 for each portfolio. This will yield a conservative estimate of the modern portfolio SWRs going back to 1996. The assumption here of course is that the modern portfolios would have performed better than the 60/40 portfolios from 1966 to 1972. I think that’s a pretty safe assumption. Below is a table of the results along with the other portfolios stats that I updated through 2014. I did not do this exercise for all the portfolios I track just the ones I discuss the most often on the blog. First, all the portfolio stats in the table are for the period from 1973 to 2014, the actual performance of the portfolios. It is only for estimating the SWRs that I inserted the 1966 to 1972 60/40 return data. I labeled that line 1966 SWRs to make that distinction. As the 1966 SWR line shows, even with the initial 7 year (1966 to 1972) equal performance to the 6o/40 portfolio all of modern portfolios have significantly higher SWRs than the classic 60/40 or even 70/30 US stock US bond buy and hold portfolio. The more broadly diversified buy and hold portfolios, IVY B&H 5, IBY B&H 13, and the Permanent Portfolios have estimated 1966 SWRs ranging from 5.06% to 5.76%. The portfolios that add simple downside risk management (via the 10 month SMA) – the GTAA5 and GTAA 13 portfolios have 1966 SWRs of 5.36% and 6.13% respectively. GTAA 13 also adds value and momentum factors to the mix. Then the portfolios that have diversification, downside risk management, value and dual momentum factors have the highest 1966 SWRs of all. The Antonacci dual momentum portfolios, GEM and GBM, have 1966 SWRs of 5.71% and 5.68%. The aggressive IVY momentum portfolios, AGG6 and AGG3 lead the bunch with SWRs of 7.95% and 8.63% respectively. Pretty impressive all the way around even after handicapping the modern portfolios with 60/40 returns from 1966 to 1972. In summary, modern portfolios have significantly higher SWRs than the classic 4% SWR rule suggests. Even in the forecasted poor return scenarios that I’ve discussed before these portfolios will most likely perform much better than the classic portfolio that the original 4% SWR was based on. Does that mean that these estimated historical SWRs can be used for investors starting to withdraw from portfolios today? Possibly but I wouldn’t go so far as that. As the infamous disclaimer goes, past returns are no guarantee of the future. All we can do is put the odds in our favor. Being the conservative sort, I base my investment allocations on one or more of these modern portfolios but still stick the 4% SWR rule. Then I adjust SWRs accordingly maybe every 3-5 years. Regardless, the superior nature of the modern portfolios, not just in terms of SWRs, should be considered by all investors. Note: There is a lot of information about modern portfolios to glean from all of the portfolio stats in the above table for investors withdrawing from portfolios and even of investors still in the wealth building phase. Just look at the differences in returns/risk and long term wealth for these modern portfolios vs the most often recommended 60/40 buy and hold portfolio. The fact that the 60/40 portfolio is still the most common allocation for US investors is kind of crazy when you see these results.

Have Bonds Lost Their Safe Haven Status To Gold?

Summary Price correlations have changed. Bonds no longer trade inversely to stocks. Bonds are no longer the safe haven. Gold is the new market safe haven. Traditionally speaking, bonds and stocks have traded inversely to each other . This is evident if one looks at these charts below. In 2008, the TLT (a bond ETF) went up in value, whereas the Dow crashed. In 2009, the TLT declined in value, whereas the Dow began its new bull market. But in 2011, that traditional correlation changed. In 2011, the bond market started to rise in correlation with the stock market. The bond market didn’t rise in an esclator like fashion such as the stock market, but it did rise in correlation with the stock market. This new correlation can be attributed to foreigners buying US assets , combined with the fact that the Federal Reserve was buying US treasuries, thus suppressing interest rates. Foreigners weren’t just buying US stocks, they have also bought US real estate as well . This form of flight capital and QE, has now made all US assets rise contemporaneously. In 2011, this wasn’t the only correlation that changed, as the two charts below show. As you can see from 2005-07, the price of gold rose in correlation with the stock market. Then in 2008, during the financial crisis, the price of gold declined with the stock market. From 2009-2011, Gold and the Dow, both rose in value. In 2011, however, that correlation changed. Gold started to decline in value, while the stock market keep rising. In my opinion, the one correlation that hasn’t changed, is the one between gold and bonds. Looking at the two charts below, I think they have always traded inversely of each other. From 2005 to 2007, gold rose in value, while the bond market remained relatively flat. During the ’08 crisis, bonds rose almost vertically, while the price of gold declined briefly. After the 08 crisis, the price of gold rose drastically, while the bond market declined. Lastly, in 2011, the bond market started to rise in value, while gold started its decline. Conclusion As stated above, one can see the price correlations have changed, this is likely due to global quantitative easing . If there is another crash, or foreigners loose confidence in the US markets, stocks and bonds will have a high a probability of declining in value at the same time, and unlike previous market panics, gold will be the new safe haven, and not bonds. I am not saying there will be a market crash soon, but if there is, it won’t be bonds that will perform well (like they did in 2008), it will be gold. Disclosure: The author has no positions in any stocks mentioned, and no plans to initiate any positions within the next 72 hours. (More…) The author wrote this article themselves, and it expresses their own opinions. The author is not receiving compensation for it (other than from Seeking Alpha). The author has no business relationship with any company whose stock is mentioned in this article.

Centrica’s Dividend Cut – How Should Shareholders React?

This week I was mildly surprised to see that Centrica ( OTCPK:CPYYF ) ( OTCPK:CPYYY ) (which I’ve owned since 2012) had cut its final dividend as part of a plan to rebase the dividend some 30% below its previous level. It wasn’t a complete surprise given the recent collapse in the price of oil, but it’s the sort of event which demands some sort of reaction. As I see it, shareholders have three main options: Panic sell: Break out in a cold sweat, curse Centrica’s management and place a sell order immediately. Do nothing: Be mildly miffed, but do nothing with the intention of holding the shares “forever”. Weekend review: Wait for the weekend and then review the company again in order to decide whether to keep holding, start selling or perhaps even buy more if the price drops enough. Reaction option 1: Panic sell If you’ve been reading this blog for a while, you’ll know that I am not a fan of panic selling, especially when it relates to an established, successful company like Centrica . Sure, panic sell an AIM-listed micro-cap mining company that operates in some country you’ve never heard of, but Centrica? I’ve written about this before, but in my view panic selling a defensive dividend payer like Centrica is like selling a buy-to-let property because its rental income drops for a year or two. Typically, rent will drop because there’s a void period, i.e. a period where one tenant leaves and another can’t be found immediately. The property sits empty for a few months and so rental income for the year is lower. Panic selling in that situation would mean putting the house up for sale immediately at a knock down price, perhaps 20% below its true market value, just to get rid of the place. To me that is just crazy. It locks in a massive capital loss just because income has dropped a little bit for a little while. The property is still there, its basic ability to generate an income is no different, and in time the income may well bounce back to where it “should” be. The same could easily be said of Centrica or any other defensive dividend payer. The same sort of situation led investors to sell Aviva (NYSE: AV ) after it cut its dividend in 2013, causing them to miss out when the share price rebounded massively shortly after (a roller coaster ride which I went through myself). Reaction option 2: Do nothing Now, this is much closer to my heart. I like to be efficient, i.e. to minimise the amount of work I need to do (which my wife describes as “lazy”). The minimum amount of work in this situation is to simply do nothing at all. In fact, this is a popular strategy which generally falls under the banner of “buy and hold”. A good example of the buy and hold approach is the High Yield Portfolio strategy (HYP) developed by Stephen Bland, which has its spiritual home on the Motley Fool bulletin boards. With HYP, defensive dividend payers are bought with attractive yields and then left untouched for all eternity, and “tinkering” with the portfolio is a definite no-no. While this sounds more attractive to me than panic selling, and is for the most part a fairly sensible strategy if you’re buying the right sort of companies, it isn’t for me. I don’t like the idea that I would buy a company in 2010 and still be holding it in 2030 without ever having thought about whether it was worth holding on to. When a company is first bought, it is analysed to make sure it’s a defensive dividend payer. At the same time, its share price is analysed to make sure the yield is sufficiently good. So, if it makes sense to check those things when the shares are bought, why does it make sense to never check them again? What if the company goes down the pan, never to recover? Surely, at some point it makes sense to move on and buy another company that is far more successful? Or what if the company does okay, but the share price doubles or triples, dropping the dividend yield to well below the market rate? Wouldn’t it make sense in that case to lock in those excess capital gains by selling? The proceeds could be reinvested into another, equally solid company but with a more attractive valuation and dividend yield? That’s not to say buy and hold isn’t a good strategy. It can be, but only for those who really do never ever want to make any investment decisions ever again, or at least no more than once every few years. For me that is far too boring and leaves far too many potential returns on the table. So, while I think doing nothing is probably much better than panic selling, I’m not going to stick with Centrica forever and ever, regardless of how it performs. I want something in between those two extremes. Reaction option 3: Weekend review And so we come to my preferred approach, which is the weekend review. The idea with a weekend review is to take the middle path between an emotionally driven knee-jerk reaction on the one hand and a complete absence of reaction on the other. It may seem odd to wait for the weekend, but there are good reasons for doing so: The markets are closed so you can’t see the price ticking lower ever few seconds and you can’t execute a trade immediately, which means you can concentrate on doing a good review without distraction It will usually be a day or so since the original unpleasant results were announced so you will have had time to calm down (although if you get upset by bad news, you’re probably not diversified enough), which should help you to think more clearly Once the weekend rolls around you would just sit down and do a thorough review of the company (Centrica in this case) using its latest results and its latest share price (using this investment spreadsheet if you like). In my case, as a defensive value investor I would be looking to see: Defensiveness: Is Centrica still a relatively defensive dividend payer (despite the dividend cut), with reasonable medium- and long-term growth prospects? Value: Is the valuation still attractive, given the company’s slower growth rate and reduced dividend? Here are Centrica’s results up to and including the dividend cut: The profits are a bit jerky but the general trend is upward, although of course there are no guarantees for the future. At 255p, the company and its shares have the following metrics, which I have compared against the FTSE 100: Growth: 10-year revenue/earnings/dividend growth rate = 8% (FTSE 100 = 1%) Quality: 10-year growth quality (consistency) = 79% (FTSE 100 = 54%) Value: PE10 ratio (price to 10-year average earnings) = 11.3 (FTSE 100 at 6,850 = 14.4) Income: Dividend yield = 4.7% (FTSE 100 = 3.4%) Profitability: ROCE = 12.4% (using post-tax profit) (FTSE 100 = 10%) By those metrics, the company still has a better track record than the market average and its share price is still more attractively valued than the market by a considerable margin. After looking at the numbers, I reviewed the company’s operations and its market, and I think it is by no means clear how Centrica will perform in the medium to long term. The oil price is uncertain, the political situation is uncertain, and the economy is uncertain. However, this degree of uncertainty is entirely normal as the future is almost always uncertain. Rather than try to predict an uncertain future, my approach is to defend against it instead. I think the best way to defend against an uncertain future is build a highly diversified portfolio of successful, established, dividend paying companies, and then for the most part to let them get on with it. On that basis, I will be holding on to Centrica for now, despite the dividend cut. Editor’s Note: This article discusses one or more securities that do not trade on a major exchange. Please be aware of the risks associated with these stocks.