Tag Archives: transactionname

Clean Energy Fuels – 2 Reasons And 4 Charts Show Why It’s A ‘Buy On The Dip’ Opportunity

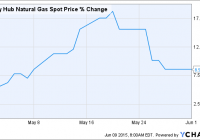
Summary CLNE will benefit from the increasing usage of natural gas in electricity generation in the long run as this will push up the price of the commodity. Though natural gas trucks cost $50,000 more than diesel trucks, they can deliver annual fuel savings of around $25,000, creating a tailwind for CLNE as this will increase NGV adoption. The drop in diesel prices hasn’t discouraged fleet operators from buying more natural gas trucks, and this will allow CLNE to maintain its volumes even in adverse circumstances. CLNE is gradually building up fueling infrastructure that will help it increase its addressable market and land more customers for fueling services in the long run. Clean Energy Fuels (NASDAQ: CLNE ) has appreciated over 50% in 2015, but the stock has lost momentum ever since it posted weak Q1 results around a month ago. In the past one month, Clean Energy shares have dropped over 13% since the company missed consensus estimates owing to slower adoption of natural gas vehicles and the decline in natural gas prices. As a result, despite an increase in volumes of natural gas delivered, Clean Energy’s financial performance contracted and its revenue was affected to the tune of $3.7 million due to weak natural gas pricing. But, in my opinion, the drop in Clean Energy’s stock price over the past one month has given investors an opportunity to buy the stock on the dip. If we look at the long run, Clean Energy will benefit from two key factors — an increase in natural gas prices and the increasing adoption of natural gas fleets. In this article, we will take a closer look at these points and see why Clean Energy is a good buy-on-the-dip opportunity. Natural gas prices have started recovering Natural gas prices have recovered slightly since the end of April as shown in the chart below: Henry Hub Natural Gas Spot Price data by YCharts The recent recovery in natural gas prices is being driven by the injection season, as demand for the fuel has increased due to low pricing and the hot weather. In fact, the latest injection season has seen strong refill activity that has exceeded the five-year average injections by a comfortable margin, according to the EIA. Additionally, the hot summer season has led to an increase in the usage of air conditioners, which has again pushed up demand for natural gas. Now, it should be noted that natural gas is increasingly replacing coal as a source of electricity generation as shown below: The basic point that I am trying to put across over here is that demand for natural gas is increasing, and this will help decrease the oversupply in the U.S. natural gas market. In fact, over the long run, usage of natural gas in electric generation will continue increasing at a steady pace as more power plants switch from coal to gas. This is because the conversion rate of natural gas into electricity stands at 90% as compared to only 30% in case of conventional fuels. Thus, as the demand-supply situation in the natural gas market improves, prices will get better. This will act as a tailwind for Clean Energy as the company suffered last quarter due to a drop in prices. In fact, over the long run the EIA expects natural gas prices to recover strongly as pointed out in its latest Annual Energy Outlook as shown below: (click to enlarge) Source Thus, investors should not worry much regarding the short-term concern around natural gas prices as the future of the commodity looks robust in the long run. Corporations are switching to natural gas vehicles despite the decline in oil prices The massive decline in oil prices over the past year has made diesel cheaper. As a result, there is not much incentive for fleet operators to convert to natural gas, as each natural gas truck costs around $50,000 more than a diesel truck. However, fleet operators are still buying natural gas-powered trucks. This is not surprising as natural gas engines can deliver identical power and acceleration as compared to diesel engines, but at the same time, natural gas is around 50% cheaper than gasoline or diesel. This will help fleet operators record major savings in the long run. For instance, a class 8 truck in the U.S. runs around 67,000 miles a year as per the Federal Highway Administration , and has a mileage of 5.2 miles per gallon of gasoline. Now, considering a conversion cost of around $50,000 per truck, a fleet operator will be a able to record strong savings as shown below: (click to enlarge) Source Hence, fleet owners will continue converting into natural gas, and this will be a tailwind for Clean Energy. As a result, it is not surprising to see that the company has signed new agreements with Potelco and Dean Foods (NYSE: DF ) to refuel their natural gas fleets. The Potelco agreement will enable Clean Energy to fuel 75 heavy-duty LNG trucks. In fact, the company has opened two truck-friendly fuel stations in Arizona and Kansas City that will support 58 CNG trucks for seaboard transport. On the other hand, the agreement with Dean Foods will allow Clean Energy to build a private CNG fueling station to fuel 64 trucks at Dean Foods’ Oak Farms Dairy plant in Houston, Texas. More importantly, Clean Energy is investing in infrastructure in order to improve the adoption of natural gas vehicles. It has opened 16 fueling stations since the beginning of the year as a part of its plan to build around 35 stations for its customers this year. As a result, Clean Energy will benefit from investments by truck makers, engine manufacturers, and other component OEMs that are increasingly focusing on natural gas vehicles. Conclusion The two key points discussed in the article clearly indicate that Clean Energy Fuels’ weak performance is temporary. The advantages of natural gas over diesel will help it get better going forward, and the increase in pricing will be another key catalyst. Thus, it makes sense for investors to buy the drop in Clean Energy’s stock price as it can be a good long-term investment. Disclosure: The author has no positions in any stocks mentioned, and no plans to initiate any positions within the next 72 hours. (More…) The author wrote this article themselves, and it expresses their own opinions. The author is not receiving compensation for it (other than from Seeking Alpha). The author has no business relationship with any company whose stock is mentioned in this article.

SCANA Corporation: A Value Play On The Utility Sector Pullback

Summary The Utilities Select SPDR Fund has seen a double digit pullback from 52-week highs. SCANA Corp. has seen even greater losses, with a share price now down over 20% from January highs. This hefty pullback has brought SCANA back into fair value, and provides a nice entry point for long term investors. Background On January 21st, I wrote an article discussing the high valuations being seen among the utilities: ” Have We Reach The Point Of Irrational Exuberance In The Utility Sector? ” It turns out this article was published just one week before the 52-week high was made in the Utilities Select SPDR ETF (NYSEARCA: XLU ). Since then the sector has been in sell-off mode, as interest rates have started to rise and continued fears of a Federal Reserve rate hike looms. One of the utilities hit the hardest during the pullback has been SCANA Corporation (NYSE: SCG ), whose shares are down over 20% since the article was published. This divergence can be seen quite clearly in the chart below. 10 Year Treasury Rate data by YCharts SCANA has seen a 50% greater correction than the rest of the sector, and as a result is now trading below fair value for the first time since the end of September, 2014. (click to enlarge) For those not familiar with F.A.S.T. Graphs , the chart above shows the share price in relation to the PE trendline over the last five years. With the recent pullback, you can see where the share price has retreated to below the long term blue 14.3 PE trendline, which represents the average PE during the period. This is the first time SCANA has traded at that level since the end of September. Company Operations & Guidance SCANA Corporation is an energy-based holding company that is headquartered in Cayce, South Carolina. SCANA was formed in 1984 and currently serves over half a million electric customers in South Carolina and more than 1.2 million natural gas customers in South Carolina, North Carolina and Georgia. These service territories can be seen below, as depicted on page 9 of the company’s March presentation . (click to enlarge) SCANA has a diversified mix of power generation capabilities with assets in coal, natural gas, nuclear and renewables. Coal currently comprises roughly 50% of the mix, but that will be decreasing in the future as the company is in the process of adding two more units to its V.C. Summer nuclear plant, which will shift nuclear to 56% of dispatch power when they are completed. (click to enlarge) This has resulted in a high amount of CAPEX due to construction costs of the new nuclear facilities. These expenditures are expected to peak in 2016 and then continue downward until the new units are commissioned in 2019 and 2020. (click to enlarge) These expenditures have continually been adjusted upwards as the project progresses and this may be an item of concern in the future if there are further delays and cost overruns. However, thus far the company has maintained its stable BBB+ credit rating and appears to have these future costs accounted for with debt offerings and expected rate increases to consumers. Company Performance SCANA has been an excellent performer throughout the years, as it is a Dividend Contender from David Fish’s CCC List , and owns a 15 year streak of increasing dividends. During this period, the company has been able to grow earnings and dividends at a steady rate, with a long term EPS growth rate of 3.9% and a dividend growth rate of 4.4%. (click to enlarge) This consistent performance has led to outsized returns when compared to the market. With reinvestment of dividends, SCANA has produced annualized returns of 8.4% over the period, which crushed the S&P mark of 5.3%, and led to twice the total returns over the period. (click to enlarge) Another highlight to note is that investors who bought at the end of 2000 did so with an initial yield of 4.0%; and through the compounding power of reinvestment and dividend increases achieved a yield on cost over 10% after 10 years. Those investors would now be receiving 12.3% of their initial investment in annual dividends. Shares are yielding 4.3% with the recent pullback, and as things currently stand, investors have a good chance of seeing a similar situation play out over the coming decade. The company is currently projected earnings growth of 3-6% over the next few years. Analysts agree, and project the high end of this range was they expect 4-6% growth over the next 5 years. Using the mid-point of guidance, here are the income projections over the next 10 years with the reinvestment of dividends. Going back to F.A.S.T. Graphs and using the handy forecaster tool with a more aggressive estimated earnings growth of 6%, new investors could hope for annualized returns of nearly 12%. (click to enlarge) 12% annualized returns may not sound like much compared with what we’ve seen in recent years in the market, but it’s still well above historical returns, and doesn’t take any outlandish predictions for it to work out. Even dropping the growth rate down to the low end of guidance would lead to annualized returns of nearly 9%, which is a nice risk/reward type of investment. Investment Risks While SCANA is certainly becoming attractive at current prices, the pullback in the sector may not be over. Treasury yields have been on a steady rise since the beginning of the year, and as long as they continue rising there could be continued weakness in the utility sector. Additionally, the company does have some risk of its own with construction costs associated with the expansion of their nuclear power plant. Any further delays would lead to higher costs, and could lead to lower dividend and earnings growth rates than what is currently forecast. Conclusion SCANA Corp. appears to be an attractive income play in the current market environment. The company looks to be financially sound with a BBB+ credit rating and provides an appealing 4.3% yield that is expected to grow at a 3-6% annualized rate going forward. With shares currently below historical valuation levels, total return investors could also be looking at high single digit annualized returns. There could still be some downward pressure on shares if interest rates continue to rise, but the relatively high dividend yield pays you to wait for the rebound. Personally, I am looking to add another utility or two to my portfolio , and am strongly considering SCANA, along with several others on my watch list. I am currently looking for possible sales to free up capital for a purchase, and may be initiating a position within the next week or two. Disclosure: The author has no positions in any stocks mentioned, but may initiate a long position in SCG over the next 72 hours. (More…) The author wrote this article themselves, and it expresses their own opinions. The author is not receiving compensation for it (other than from Seeking Alpha). The author has no business relationship with any company whose stock is mentioned in this article. Additional disclosure: I am a Civil Engineer by trade and am not a professional investment adviser or financial analyst. This article is not an endorsement for the stocks mentioned. Please perform your own due diligence before you decide to trade any securities or other products.

Why I Am Hedging My Portfolio With UVXY

Summary The stock market is hovering near all time highs. The current bull market at 6 years is approaching the historical average. The VIX Index has not closed a month over 30 in more than 3 years. I usually stay away from investments that do not have tangible asset backing, but I have made an exception in the case of the Pro Shares Ultra VIX Short Term ETF (NYSEARCA: UVXY ). Perfect Portfolio Insurance What exactly is UVXY? According to its prospectus on the Pro Shares website, it seeks daily investment results that correspond to 2x the daily performance of the S&P 500 VIX Short-Term Futures Index. What this basically means is that this ETF rises and falls with the level of the VIX, which is more commonly referred to as “The Fear Index.” With general market levels at all time highs, there is not much fear permeating today’s business landscape. However, as market historians have learned time and again, fear is one of the most powerful human emotions, and can skyrocket at a moment’s notice. Let’s look at some of the possible reasons why the VIX could increase dramatically in the near future. The VIX Is Below Its 20-Year Averages Take a look at the following 20 year chart for the VIX: ^VIX data by YCharts As you can see, the VIX hasn’t closed a month above 30 since November of 2011, over 3 years ago. The VIX has risen to 30 or above on 10 different occasions throughout the past two decades, leaving us with an average of one spike above 30 every two years. The longest time the VIX remained below 30 was 3/31/03-9/30/08, a period of 5.5 years. Although this was a long wait, the VIX jumped all the way to its 20 year high of over 65 shortly thereafter. An era of low fear can only exist for so long in the volatile world of the stock market. This current run of low VIX readings is the second longest of the past two decades, and the longer that it continues, the higher the probability of a spike, based on historic averages. The Current Bull Market Is Almost 6 Years Old As a student of the stock market, I am fascinated by the bull and bear trends that are the fabric of investing. Although hindsight is always 20/20 in the stock market, the current trend is approaching the historical average bull market length. The longer that the market keeps running, the harder the inevitable fall will become. Since the 1950s, there have been 9 bear markets , which are defined as a drop in the S&P 500 by 20% or more from its high point. That leaves us with roughly one bear market every 6.5 years. The current bull market began in March 2009, which makes it almost 6 years old. The longer that this bull market runs past its historical average, the higher the likelihood that it will sell off and become a bear market. Current Statistics Indicate An Overvalued Market I’d love to say that I can predict exactly when the correction will happen, but I know that is a fool’s errand. I just know that the longer a trend continues in the stock market, the more people believe it to be true, which is ultimately when the sentiment changes. Robert Shiller, a renowned economist, created the Cyclically Adjusted Price-Earnings (CAPE) ratio in an effort to create a gauge of how expensive the current market is. It is tallied by dividing price by the 10 year moving average of earnings, adjusted for inflation. Check out the following historical CAPE chart for the S&P 500: S&P 500 Cyclically Adjusted Price-Earnings Ratio data by YCharts As you can see, we are currently at the same level that we were at during the peak of the 2008 market, and just under the level of the infamous 1929 crescendo. This does not mean that a crash is imminent, but it does mean that we are entering dangerous waters. Another tell tale sign of a roaring bull market is high speculation on margin. This chart shows an eerie correlation between stock prices and margin levels: (click to enlarge) Source: Business Insider As the famous Mark Twain quote goes, “history doesn’t repeat itself, but it does rhyme.” As stock prices keep increasing, people become more confident, and overextend themselves. It is a reality of the stock market today. Unless we are truly entering a fairy tale era of high margin speculation and never ending growth, this trend has to reverse itself eventually. Other Considerations The Federal Reserve has officially ended its unprecedented QE program, which has been the largest economic stimulus in world history. This is important because it is now only a matter of time before the Fed raises interest rates. It will be fascinating to see how the financial markets react to the inevitable rate hike. This will negatively impact earnings for thousands of companies that rely on borrowed money. When this happens, volatility will spike. From a macro perspective, it is a harsh reality that there is a tremendous amount of uncertainty in the world today. With Greece teetering on the edge of default and ISIS being in the news almost daily, there is high potential for a negative trigger sometime in the near future. Unfortunately, subprime lending is making a comeback and student loan debt is burdening an entire generation, causing first time home buyer rates to drop to 30 year lows . As the student loan generation ages, they will have less disposable income to spend, and thus will impact the revenues of many companies. All of these are potential catalysts that could trigger a long overdue negative reaction in the stock markets. Why Choose A Leveraged Fund? The reason I chose a leveraged ETF like UVXY rather than a standard futures ETF like the iPath S&P 500 VIX Short Term Futures ETF (NYSEARCA: VXX ) is simple: a strong conviction that the facts mentioned above will contribute to a market volatility higher than current levels in the near future. UVXY attempts to return 2x the VIX’s performance for that particular day. This means that when a spike in volatility occurs, UVXY will significantly outperform VXX, which only attempts to achieve 1x the VIX performance. Although UVXY will decline more than VXX in a low volatility market, the increased profit potential outweighs that drawback in my opinion. Risks There is one dominant risk concerning this strategy: the structure of UVXY itself. UVXY is a leveraged futures ETF, which means that it suffers exponential decay when in a period of contango. Contango is when the futures price is more expensive than the current spot price. Unfortunately, in a low volatility market like the present one, UVXY is in contango the majority of the time. Accordingly, the risk of holding UVXY for a long period of time should be obvious. It WILL lose money if the market keeps up its slow ascent and fear fails to materialize. However, history shows us that record high stock prices and low volatility cannot go on indefinitely. It is of utmost importance to exit a position in UVXY as soon as the VIX spikes in a significant way. Why is this? Because fear is a much stronger emotion than greed, but lasts for a much shorter time, which makes the spikes that much more pronounced. Accordingly, fear can vanish in an instant, so huge gains in a vehicle like UVXY can vanish in the blink of an eye. Conclusion Although the near future in stocks may continue to be bright, I believe that preparing for the worst is always a good strategy. As a holder of equities, I am hoping that the stock market continues its upward trend, but I will be prepared if it does not. I consider the decay of UVXY the monthly premium that I pay in order to hold insurance in the case of disaster. If any of the aforementioned negative triggers materialize, UVXY should increase in value, which will then allow me to add to my long positions at lower prices. As Warren Buffett is famously quoted: “Only when the tide goes out do you realize who’s been swimming naked.” All I know is that when the wave of fear hits, at least I’ll have my bathing suit on. Disclosure: The author is long UVXY. (More…) The author wrote this article themselves, and it expresses their own opinions. The author is not receiving compensation for it (other than from Seeking Alpha). The author has no business relationship with any company whose stock is mentioned in this article.