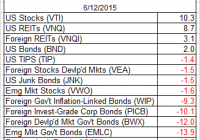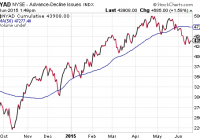
Sky high stock valuations do not matter in an era of worldwide central bank rate manipulation. And yet, there are a few things that may still carry weight with the global investing community as we move forward in 2015. The way that I view it, the appeal of all risk assets in the large-cap universe had shot out of a cannon in the first half of 2013. In 2015, however, the S&P 500 A/D line has flattened out. Several years ago, Rolling Stone ranked the 10 best movies by former cast members of Saturday Night Live. Bill Murray barely made the list with Rushmore – an offbeat comedy from the late 90s. I remember thinking that Murray had been cheated in the editorial; he should have received additional nods for Caddyshack, Stripes, Lost In Translation as well as What About Bob. In that vein, how on earth did they miss the quintessential camper experience from my youth, Meatballs? Granted, Meatballs did not have the critical acclaim of Lost in Translation or the monumental influence of Caddyshack; the writer may not have been alive in the 70s. Nevertheless, Meatballs had one of the most iconic quasi-motivational speeches ever. Murray’s character, head counselor Tripper Harrison, persuades a band of misfit teens to take on the elite athletes from another camp by celebrating nonconformity. Here’s a snippet from the inspirational talk: Murray (Tripper Harrison): Even if every man, woman and child held hands together and prayed for us to win, it just wouldn’t matter, because all the really good looking girls would still go out with the guys from Mohawk ’cause they’ve got all the money! It just doesn’t matter if we win or we lose. Campers and Counselors: IT JUST DOESN’T MATTER! IT JUST DOESN’T MATTER! IT JUST DOESN’T MATTER! Thirty six years since the release of Meatballs, I find my mind drifting back to Bill Murray’s humorous exchange with his dejected campers. (In some ways, he may have been speaking directly to movie-goers.) I address legitimate concerns about risk assets regularly. And yet, sky high stock valuations do not matter in an era of worldwide central bank rate manipulation. I chronicle the good, the bad and the ugly about the economy daily. And still, it just doesn’t matter to the risk-on herd. For example, it has been well-documented that the price-to-book (P/B), price-to-sales (P/S) and P/E) of the median stock on U.S. exchanges have never been higher. Not even during the dot-com craziness in March of 2000. Similarly, U.S. stock market value as a percentage of gross national product is at 150%; that represents the second highest level in U.S. history. Warren Buffett wrote in 2001 that when one buys stocks in the 70%-80% range, the decision is likely to work out well. At present, the “Buffett Indicator” is 2x preferred levels. Does it matter? Not in the immediate term. What about the economy that has been lumbering along at a 2% clip for six-and-a-half years? Those sub-par growth results in the recovery required extraordinary emergency measures of $3.75 trillion in asset purchases by the Federal Reserve System; it also required federal government excess spending of $7.5 trillion. More recently, industrial production – a measure of output for manufacturers, miners and utilities – dropped 0.2% in May and has not increased since November of last year. The Federal Reserve Bank of New York’s Empire State manufacturing survey registered a negative reading (-2.0) in June – its second negative report in the last three months. Does it matter? Not particularly. In contrast, there are a few things that may still carry weight with the global investing community as we move forward in 2015. For instance, the evidence surrounding the potential for a disorderly exit by Greece from the euro suggests that markets may struggle a bit more than most media pundits are willing to acknowledge. More importantly, recent downshifts in market breadth have convinced me that a defensive allocation is warranted. Keep in mind, when investors are gaga for risky assets, they often acquire them across the board. Yet both the NYSE and the S&P 500 have seen a definitive breakdown in the number of advancers compared with the number decliners. The NYSE Advance Decline Line (A/D) has not been this far below its near-term 50-day moving average since the October swoon and the November “Bullard Bounce.” The S&P 500 is also losing some if its participants in the rally. Throughout May and June, less and less of component companies are moving higher in established uptrends. During highs that were established over the last six months, bullish breadth readings clocked in near 75%. Bullishness via the Bullish Percentage Index (BPI) for the S&P 500 is about as weak as it was in February. We can even take a look at the slope of the advance/decline line for the S&P 500. The way that I view it, the appeal of all risk assets in the large-cap universe had shot out of a cannon in the first half of 2013. And while the desire tapered off a bit between the 2nd half of 2013 and the end of 2014, the passion was still there. In 2015, however, the S&P 500 A/D line has flattened out. Granted, the benchmark can still move higher with less and less corporate shares participating; market-cap weighted indexes concentrated in the “Apples” will do that. On the flip side, weakening breadth can also mark a turning point such that stocks will move dramatically higher or dramatically lower. Indeed, we have been approaching a critical crossroads. The Federal Reserve is deciding whether to begin a campaign of tightening borrowing costs slightly or to wait for definitive data that is unlikely to ever confirm genuine economic strength. More importantly, what the Fed actually does will be far less important than the interpretation by the global investing community. The Fed might raise rates 0.125% at a 2015 meeting that is so slow, risk-takers would likely celebrate; the Fed might raise overnight lending rates 0.25% while simultaneously expressing that they won’t do so again until three months of upbeat data. Conversely, the Fed could misread the signals by simply hiking borrowing costs on the belief that the economy is healthy enough to withstand the heat, spiking volatility in treasuries as well as equities. Or, they might sound so downbeat in their assessment, stocks could flounder on recessionary fears. In other words, different things matter at different times. Keep an eye on the iShares 7-10 Year Treasury Bond ETF (NYSEARCA: IEF ). If the price of IEF climbs above and stays above its 200-day moving average, it may suggest that fears of Fed rate hikes were overblown. Stocks would likely benefit from contained borrowing costs. In contrast, if IEF stays below its 200-day and drops significantly below its June low near 104, expect corrective activity for riskier stock assets. Click here for Gary’s latest podcast. Disclosure: Gary Gordon, MS, CFP is the president of Pacific Park Financial, Inc., a Registered Investment Adviser with the SEC. Gary Gordon, Pacific Park Financial, Inc, and/or its clients may hold positions in the ETFs, mutual funds, and/or any investment asset mentioned above. The commentary does not constitute individualized investment advice. The opinions offered herein are not personalized recommendations to buy, sell or hold securities. At times, issuers of exchange-traded products compensate Pacific Park Financial, Inc. or its subsidiaries for advertising at the ETF Expert web site. ETF Expert content is created independently of any advertising relationships.