Tag Archives: nysearcabnd

Ivy Portfolio August Update

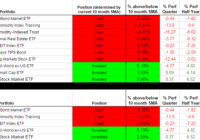
The Ivy Portfolio spreadsheet tracks the 10-month moving average signals for two portfolios listed in Mebane Faber’s book, The Ivy Portfolio: How to Invest Like the Top Endowments and Avoid Bear Markets . Faber discusses 5, 10, and 20 security portfolios that have trading signals based on long-term moving averages. The Ivy Portfolio spreadsheet tracks both the 5 and 10 ETF portfolios listed in Faber’s book. When a security is trading below its 10-month simple moving average, the position is listed as “Cash”. When the security is trading above its 10-month simple moving average, the positions is listed as “Invested”. The spreadsheet’s signals update once daily (typically in the late evening) using the dividend/split adjusted closing price from Yahoo Finance. The 10-month simple moving average is based on the most recent 10 months, including the current month’s most recent daily closing price. Even though the signals update daily, it is not an endorsement to check signals daily or trade based on daily updates. It simply gives the spreadsheet more versatility for users to check at his or her leisure. The page also displays the percentage each ETF within the Ivy 10 and Ivy 5 Portfolio is above or below the current 10-month simple moving average, using both adjusted and unadjusted data. If an ETF has paid a dividend or split within the past 10 months, then when comparing the adjusted/unadjusted data you will see differences in the percent an ETF is above/below the 10-month SMA. This could also potentially impact whether an ETF is above or below its 10-month SMA. Regardless of whether you prefer the adjusted or unadjusted data, it is important to remain consistent in your approach. My preference is to use adjusted data when evaluating signals. The current signals based on July 31st’s adjusted closing prices are below. This month the Vanguard Total Bond Market ETF (NYSEARCA: BND ), the SPDR Dow Jones International Real Estate ETF (NYSEARCA: RWX ), the Vanguard FTSE Emerging Markets ETF (NYSEARCA: VWO ), the PowerShares DB Commodity Index Tracking ETF (NYSEARCA: DBC ), the iShares S&P GSCI Commodity-Indexed Trust ETF (NYSEARCA: GSG ), the Vanguard REIT Index ETF (NYSEARCA: VNQ ) and the iShares TIPS Bond ETF (NYSEARCA: TIP ) are below their 10-month moving average. The spreadsheet also provides quarterly, half yearly, and yearly return data courtesy of Finviz. The return data is useful for those interested in overlaying a momentum strategy with the 10-month SMA strategy: (click to enlarge) I also provide a “Commission-Free” Ivy Portfolio spreadsheet as an added bonus. This document tracks the 10-month moving averages for four different portfolios designed for TD Ameritrade, Fidelity, Charles Schwab, and Vanguard commission-free ETF offers. Not all ETFs in each portfolio are commission free, as each broker limits the selection of commission-free ETFs and viable ETFs may not exist in each asset class. Other restrictions and limitations may apply depending on each broker. Below are the 10-month moving average signals (using adjusted price data) for the commission-free portfolios: (click to enlarge) (click to enlarge) Disclosure: None
Tough Times For Broadly Diversified Portfolios

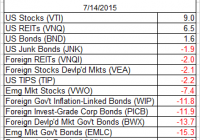
How’s your globally diversified strategy faring these days? Having a tough time? You’re not alone – the headwinds are fierce. For the first time in recent memory, the overwhelming majority of the major asset classes are in the red on a trailing one-year basis. As a result, broadly defined asset allocation strategies are suffering, at least relative to the stellar numbers in recent years. Using a set of ETF proxies for the trailing 250-day (1 year) total return, only US stocks, US REITs (real estate investment trusts), and US bonds (broadly defined) are posting gains among the major asset classes. By contrast, the other 11 asset classes are in varying states of loss over that period. Here’s another view by indexing all the ETFs to 100 as of July 16, 2014… ouch! (click to enlarge) Given the current environment, it’s no surprise that a broadly defined asset class strategy has stumbled lately. For instance, consider an ETF-based version of an unmanaged, market value weighted mix of all the major asset classes – the Global Market Index Fund, or GMI.F, which holds all the ETFs in the table above. Here’s how GMI.F stacks up for the past 250 trading days through yesterday (July 14, 2015). This investable strategy is ahead by less than 1% over that span – below the performance for US stocks (NYSEARCA: VTI ) and US bonds (NYSEARCA: BND ). (click to enlarge) Is GMI’s diminished performance surprising? Maybe, but only if you weren’t paying attention. Risk premia projections for GMI have been relatively soft for some time ( see this month’s update, for instance) – after several years of hefty gains for GMI and equivalent strategies. The lesson, of course, is that mean reversion is alive and well when it comes to market (and portfolio strategy) returns. Share this article with a colleague

June AAII Asset Allocation Survey: Cash Levels Continue To Rise

Stock and stock fund allocations declined but remain above their historical average for the 27th month in a row. Bond, bond fund and cash allocations only showed minor changes this month. Of alternative investments held by members, real estate is represented the most. The June AAII Asset Allocation Survey reveals that individual investors increased their cash allocations for the third consecutive month. The rise in cash levels occurred as equity allocations fell to their lowest level since January. Stock and stock fund allocations declined 0.5 percentage points to 67.2%. June tied January for having the smallest allocation to equities in 2015. Nonetheless, stock and stock fund allocations remained above their historical average of 60% for the 27th consecutive month. Bond and bond fund allocations were unchanged at 15.5%. Technically bond fund allocations declined and bond allocations rose, but the changes were very minor. June was the second consecutive month with fixed-income allocations below their historical average of 16.0%. Cash allocations edged up 0.5%, to 17.3%. This third consecutive monthly increase kept cash allocations at their highest level since October 2014 (18.7%). The increase was not large enough to keep cash allocations from being below their historical average of 24% for the 43rd consecutive month, however. The rising level of cash corresponds with trends we’ve been seeing in our weekly Sentiment Survey. Neutral sentiment has been at an unusually high level for 12 consecutive weeks. Neutral sentiment’s record streak of consecutive weekly readings at or above 45% for 10 consecutive weeks lasted through much of last month. At the same time, many individual investors continue to be frustrated by the ongoing low-interest-rate environment. June’s special question asked AAII members if any portion of their portfolio is allocated to alternative investments (something we do not track in our monthly survey). Almost half of all respondents (49%) said no, they do not hold any alternative investments. Some said they have no interest in owning them, while others suggested they needed to learn more about these types of investments before deciding to allocate to them. A small group of members asked us to define what counts as an alternative investment. Slightly more than a third (35%) said they own alternative investments. Many described their allocations to “alts” as accounting for 10% or less of their total portfolio. Real estate was most common, with 15% of all respondents saying they had exposure to it either through real estate investment trusts (REITs) or via a direct ownership. One member has ownership in a vineyard. Here is a sampling of the responses: “I do not and will not consider ‘alternative investments.'” “No, because I do not have enough information about ‘alternative investments’ for evaluation.” “Not much…I tried silver, gold, stamps, and convertible bonds; no returns are as good as stocks.” “Yes, about 8% to 10% of my portfolio is in ‘alternative investments.'” Note: A spreadsheet error led to incorrect data being sent out in last month’s press release. The correct numbers for May’s Asset Allocation Survey were as follows: stocks and stock funds: 67.7% (down 0.2 percentage points), bonds and bond funds: 15.5% (down 0.7 percentage points) and cash: 16.9% (up 1.0%). June AAII Asset Allocation Survey results: Stocks and Stock Funds: 67.2%, down 0. 5 percentage points Bonds and Bond Funds: 15.5%, unchanged Cash: 17.3%, up 0.5 percentage points June AAII Asset Allocation Survey details: Stock Funds: 33.5%, down 1.1 percentage points Stocks: 33.6%, up 0.6 percentage points Bond Funds: 11.8%, down 0.1 percentage points Bonds: 3.8%, up 0.1 percentage points Historical Averages: Stocks/Stock Funds: 60% Bonds/Bond Funds: 16% Cash: 24% *The numbers are rounded and may not add up to 100%. The AAII Asset Allocation Survey has been conducted monthly since November 1987 and asks AAII members what percentage of their portfolios are allocated to stocks, stock funds, bonds, bond funds and cash. The survey and its results are available online here . Disclosure: I/we have no positions in any stocks mentioned, and no plans to initiate any positions within the next 72 hours. (More…) I wrote this article myself, and it expresses my own opinions. I am not receiving compensation for it. I have no business relationship with any company whose stock is mentioned in this article.