Tag Archives: nreum

Why Is A U.S. Mutual Fund Company Interested In E3 Gaming Expo?

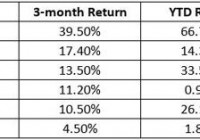
The video game’s annual interactive extravaganza event, Electronic Entertainment Expo, officially kicked off Monday at the Los Angeles Convention Center. Popularly called E3, the event showcases some exciting yet-to-be-launched game titles and consoles. What is interesting for mutual funds is that an American mutual fund firm has just became the largest shareholder in Nintendo ( OTCPK:NTDOY ). Apart from the craze for virtual reality systems, video streaming services and games specifically designed for PCs and mobile devices, many say the console games demand will prove its strength. That should again be good news for Nintendo and other console makers. According to DFC Intelligence estimates, sales of console systems including Xbox One, Nintendo’s Wii U and PlayStation 4, and their respective games may reach $15 billion in 2015. This is a 7% jump from last year. Also, there are a host of press conferences lined up from major companies, sparking further expectations for gamers and investors. Gaming industry giants like Sony (NYSE: SNE ), Microsoft Corp. (NASDAQ: MSFT ), Nintendo, UbiSoft Entertainment SA ( OTCPK:UBSFY ), and Bethesda Softworks, LLC are holding press conferences. Mutual funds having exposure to the video gaming industry are funds to watch out for now. U.S. Mutual Fund Now Top Nintendo Shareholder A filing with Japan’s Finance Ministry showed investment adviser to the American Funds family, Capital Research & Management, owned 16.4% stake in Nintendo. This is up from 15.3% in early March. This increased stake reflects the increasing amount of bets on the Japanese videogame company’s fortunes and revival efforts. Nintendo’s Wii U videogame console has lagged rivals like Sony’s PlayStation 4 and Microsoft’s Xbox One. However, Nintendo has been making efforts recently to gain momentum. Nintendo has made a move to expand its classic franchises into new areas. In March, Nintendo finally entered the mobile gaming business by collaborating with leading Japanese mobile game maker, DeNA. Under the deal, the two companies will develop gaming applications for smart devices based on Nintendo’s intellectual property. According to market research firm, NPD Group, the Nintendo 3DS video game console became the top selling video game hardware platform in the U.S. in February. Nintendo at E3 At E3, Nintendo will not have a traditional press conference. Instead, it will have the Nintendo Digital Event, a pre-recorded announcement. It will be streamed online on Jun 16. The company’s main highlights will be Fire Emblem X Shin Megami Tensei, Star Fox Wii U and Mario Maker. In the E3 event, Nintendo also had a Pre-E3 Super Smash Bros. video presentation on June 14. This had a lot of revelations about the Wii U and 3DS games’ futures and they are slated for major updates. Among other announcements, gamers are looking forward to the gameplay reveal for Star Fox (Wii U). It is the sequel to Nintendo Star Fox 64, which was announced after Nintendo’s E3 conference in 2014. Is E3 a Major Boost for Video Game Makers? The world’s biggest video game show definitely offers a major business opportunity for video game developers. These companies not only get to exhibit their upcoming titles and products but also create a certain hype, which helps drive sales, especially for titles/products launched after the E3 event. Of late, the video game industry hasn’t done too good financially. Last year, U.S. software sales of games declined 14% to $5.47 billion. However, hardware sales rose 20% to $5.07 billion, partly saving the industry with a 1% net increase in retail sales. Things went further downhill in the first half of 2015, with overall industry sales decreasing 13% to $507.6 million. Reportedly, software sales were down 25%, while hardware sales dropped 18% year over year. Video Game Industry Stock Performance The table below, presents the stock performance of some of the major players in the video game industry: (click to enlarge) Calculated via Google Finance Meanwhile, Sony has soared 87.7% over the 1-year period while its year-to-date return is 48.7%. However, Microsoft is down 1% so far this year and its 1-year return is 11.5%. US Mutual Funds’ Exposure to Gaming Industry E3 is a perfect platform for the video game industry with companies showcasing and promoting their upcoming products and experiences to boost demand. Since the event has kicked off, let’s look at the top mutual fund holders. Major fund houses like Fidelity and Vanguard have exposure to the video gaming industry. For example, Fidelity OTC Portfolio (MUTF: FOCPX ), carrying a Zacks Mutual Fund Rank #2 (Buy), holds 2.03% total shares in Activision. As of May 31, Vanguard Total Stock Market Index had 1.22% of total shares and as of Apr 30. According to Morningstar, Vanguard Mid-Cap Index (MUTF: VMCIX ) had 1.85% of total shares of Electronic Arts as of May 31. American Century Heritage Investor (MUTF: TWHIX ) and Prudential Jennison Mid Cap Growth A (MUTF: PEEAX ) are also major investors in Electronic Arts. While TWHIX carries a Zacks Mutual Fund Rank #3 (Hold), PEEAX holds a Zacks Mutual Fund Rank #4 (Sell). Coming to Nintendo, Fidelity Select Technology Portfolio (MUTF: FSPTX ), Fidelity Advisor Technology A (MUTF: FADTX ) and Praxis International Index A (MUTF: MPLAX ) own shares in the console maker. While FSPTX carries a Zacks Mutual Fund Rank #1 (Strong Buy), FADTX is Buy rated while MPLAX holds a Zacks Mutual Fund Rank #3. Original Post Editor’s Note: This article discusses one or more securities that do not trade on a major U.S. exchange. Please be aware of the risks associated with these stocks.

VNQ: Take The 3.85% Yield; Duplication Is Rarely Worth It

Summary I’ve been getting questions about why investors should choose VNQ over buying largest holdings within VNQ. VNQ offers substantially better diversification than investors can create by replicating the top holdings. The ETF yield is surprisingly similar to the yields across the top holdings. If an investor is committed to a plan of dollar cost averaging, VNQ offers a smart way to minimize trading costs. Vanguard REIT Index ETF (NYSEARCA: VNQ ) offers investors strong distribution yields at a rate of 3.89%. However, some investors are contemplating if they would be better off simply buying the top 5 or 10 holdings of VNQ to avoid the expense ratio and generate more income by concentrating their investments in the REITs with the highest yields. It’s a reasonable idea and it is worth some discussion. I wanted to offer a thorough response on some of the reasons that I believe investing in VNQ is superior to trying to replicate the portfolio through buying the top ten holdings. Holdings I put together a quick chart showing the recent holdings of VNQ based on their most recent market values. (click to enlarge) The top 10 holdings make up about 37% to 38% of the value of the ETF. That is a fairly substantial portion, but not substantial enough that it would make it easy to duplicate the fund by buying the top holdings. An investor that only buys the top 10 would still be missing out on a very substantial amount of diversification from the other 62% or so of the portfolio. Dividend Yields I put together a chart showing the dividend yields on each of the top 10 positions. For the convenience of readers, I kept the holdings in the same order rather than sort them by the highest dividend yields: (click to enlarge) There are certainly a few REITs in this ETF that are paying much higher yields than the main portfolio, but investors focusing on only the highest yield REITs will be putting themselves at risk for slower growth in the pay outs or more risk to the dividend itself. Higher yields are often related to higher levels of risk, so holding only the highest yielding REITs would result in a significantly higher concentration of risk. If you were to take the average yield (equally weighted) of the top 5 REITs, you would have 4.018%. If you take the average yield across the top 10, it is 3.764%. This suggests that all around VNQ is paying a fairly similar level of dividends to what an investor would expect if they focused on buying the top 5 or top 10 holdings by market value in an equally weighted portfolio. Expense ratios are fairly low The Vanguard REIT Index ETF has an expense ratio of only .12%. That does cost shareholders money compared to simply holding all of the underlying securities, but the cost is fairly low compared to the benefits. In exchange for the .12% ratio the investors are able to buy shares in a high liquid ETF with the spread is frequently one cent. On a share price that is floating around $77, that is a very attractive bid ask spread. For comparison, at the time of my checking Simon Property Group, Inc. ( SPG) had a 4 cent bid ask spread on a price around $176 (slightly better larger than VNQ), P ublic Storage (P SA) had a spread of 4 cents on a price around $187, Equity Residential ( EQR) had a spread of 1 cent on shares running around $70 (about equal to VNQ), and Health Care REIT, Inc. ( HCN) had a spread of 2 cents on a price slightly under $70. In short, the Bid-Ask spread on even the largest equity REITs is slightly worse than the spread on VNQ. Granted, if you have an indefinite holding time period the spread is only an issue when purchasing, but it does increase the cost of buying into the position. If an investor has free trading on VNQ (some brokerages do), then their trading cost to buy into positions is limited to crossing the spread. If an investor is simply doing a buy and hold with a 40 year time frame, this isn’t a huge consideration. For the investor with a 40 year time frame that is buying their REITs in one single purchase, it makes sense to replicate the fund. For an investor with a long time frame that intends to continue investing REITs by buying into their position every month or every quarter for dollar cost averaging, it would be better to take advantage of the low spreads and look for a brokerage that is offering no commissions on VNQ. Conclusion While it would be possible to generate higher yields than VNQ by picking the equity REITs with the highest yields, it would also leave an investor facing significantly more diversifiable risk. The extra income may be nice and replicating the portfolio through buying a very large volume of the securities (you’d need more than 10) would make sense for a long term investor that does not plan to be investing new money every month or every quarter. For the investor that is planning to dollar cost average into their investments and builds them up over a period of years, the purchases will be more frequent and the investor may save more on trading commissions and spreads than they lose on the expense ratio. Whether this works or not will depend on the individual investor. My dollar cost averaging strategy puts in place a minimum amount of purchasing activity for REITs, but I will occasionally add to the position when I see share prices fall. Disclosure: The author is long VNQ. (More…) The author wrote this article themselves, and it expresses their own opinions. The author is not receiving compensation for it (other than from Seeking Alpha). The author has no business relationship with any company whose stock is mentioned in this article. Additional disclosure: Information in this article represents the opinion of the analyst. All statements are represented as opinions, rather than facts, and should not be construed as advice to buy or sell a security. Ratings of “outperform” and “underperform” reflect the analyst’s estimation of a divergence between the market value for a security and the price that would be appropriate given the potential for risks and returns relative to other securities. The analyst does not know your particular objectives for returns or constraints upon investing. All investors are encouraged to do their own research before making any investment decision. Information is regularly obtained from Yahoo Finance, Google Finance, and SEC Database. If Yahoo, Google, or the SEC database contained faulty or old information it could be incorporated into my analysis.

Put The iShares MSCI Indonesia ETF On The Watch List

Indonesia has potential, but the right policies are not in place. Indonesia suffers from high inflation and poor infrastructure. If Indonesia gets its act together, the Indonesian stock market will do as well as the Indian stock market. By Jay Smith A decade and half ago, Goldman Sachs economist Jim O’Neill predicted that the economies of Brazil, Russia, India, and China would play a much larger role in the global economy than they did before. At the time, China, India and Brazil were minor players in an economic world dominated by Europe and the United States. Now, O’Neill’s prediction has more than came true, as the BRIC economies have grown, driven demand, and created many alpha investment opportunities. Now Jim O’Neil also has a new prediction, that Mexico, Indonesia, Nigeria, and Turkey (MINT) will be the next countries to develop quickly and drive demand. Of the MINT countries, Indonesia looks particularly attractive. Indonesia is the fourth most populous country in the world, with 250 million people. It has great demographics, with the median age being just 29.2 years and a total dependency ratio of 51%. Indonesia also has strong growth potential, with a GDP per capita of just $3,400 versus the global average of over $10,000. Jim O’Neill originally left Indonesia out of the BRIC countries because he didn’t think that the Indonesian government was doing enough to realize its potential. Now O’Neill believes that Indonesians are asking the right questions about what they can do to accelerate their growth. Because they have been asking the right questions, Indonesia’s growth has increased, with the country growing GDP at 6.2% in 2010, 6.5% in 2011, 6.3% in 2012, and 5.8% in 2013. Inflation has been a problem, however, with inflation rising from 4% in 2012 to 7% in 2015. Inflation is why shares of Indonesian ETFs such as the iShares MSCI Indonesia ETF (NYSEARCA: EIDO ) have not done well in dollar terms. The iShares MSCI Indonesia ETF is a passive ETF that tracks the MSCI Indonesia Investable Market Index. It has an annual expense ratio of 0.62%. Bank Central Asia (OTC: PBCRF ), Telekomunikasi Indonesia (NYSE: TLK ), Astra International (OTCPK: PTAIF ) are its top three holdings. Since its inception, the iShares MSCI Indonesia ETF has averaged an annual return of 4.57%, lower than the S&P 500’s return. Even worse, the ETF has averaged an annual return of negative 2.45% in the last 3 years. At the current moment, iShares MSCI Indonesia’s fundamentals are unattractive, with an average PE ratio of 21.35 and an average price to book ratio of 4.92. Performance will remain weak for a few more quarters, as rising treasury yields prompt capital outflows from emerging markets. Capital leaving Indonesia will increase inflation by weakening the rupiah. In the long run, iShares MSCI Indonesia ETF has potential because Indonesia will put the right policies in place one day. If it adopts the same policies and infrastructure building program as India did a few years ago, Indonesia’s stock market will rally like the Indian stock market has. Moreover, many hedge funds also own the iShares MSCI Indonesia ETF’s largest components. AQR Capital Management and Jim Simon’s Renaissance Technologies both own Telekomunikasi Indonesia . DE Shaw owns the stock too. Our research shows that the 15 most popular small-cap stocks among hedge funds have outperformed the market by nearly a percentage point per month between 1999 and 2012. We have been forward testing the performance of these stock picks since the end of August 2012. These stocks managed to return more than 132% over the ensuing 2.5 years and outperformed the S&P 500 Index by nearly 80 percentage points . The hedge fund ownership of Indonesian stocks is a good sign. The iShares MSCI Indonesia ETF is not a buy yet, but it should be on the watch list. Editor’s Note: This article covers one or more stocks trading at less than $1 per share and/or with less than a $100 million market cap. Please be aware of the risks associated with these stocks. Disclosure: The author has no positions in any stocks mentioned, and no plans to initiate any positions within the next 72 hours. (More…) The author wrote this article themselves, and it expresses their own opinions. The author is not receiving compensation for it (other than from Seeking Alpha). The author has no business relationship with any company whose stock is mentioned in this article.