Scalper1 News
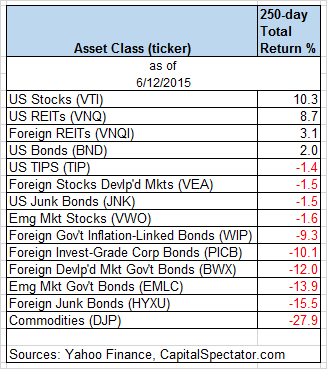
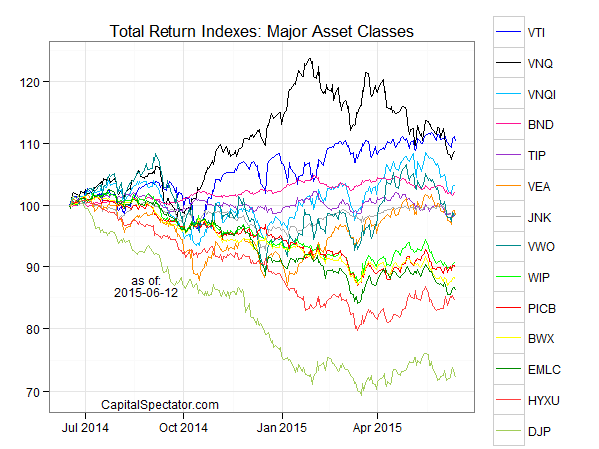
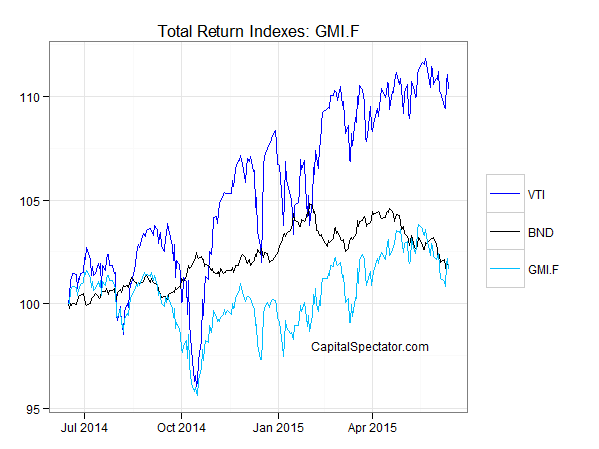
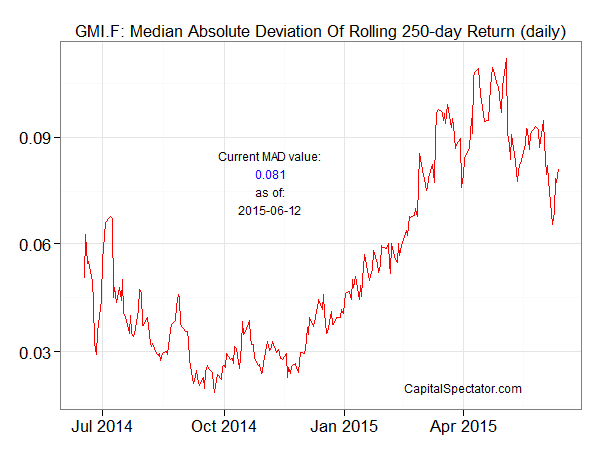
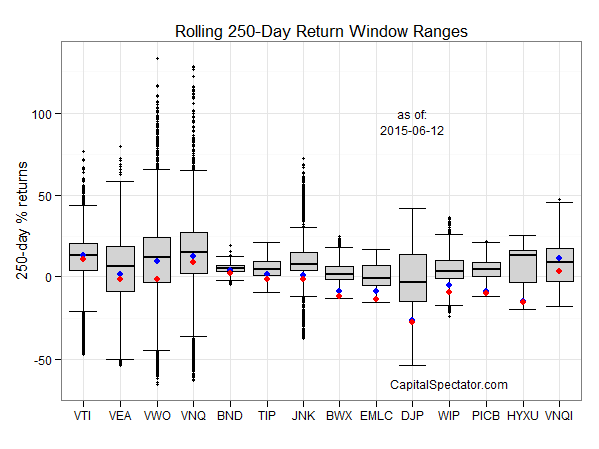 The U.S. equity market has regained front-runner status for the trailing one-year return (250 trading days) among the major asset classes, but the edge is looking considerably less impressive compared with the glory days of recent years. In fact, rolling one-year returns overall are a diminished lot lately, based on our standard set of ETF proxies that track broad measures of the global opportunity set. There are fewer positive returns for the trailing 250-day period while the performance histories that are still in the black reflect relatively modest gains vs. recent history. In short, earning a risk premium isn’t getting any easier. That’s another way of saying that there’s more red ink weighing on the one-year profiles. Ten of the 14 ETFs that track the major asset classes have lost ground over the past 250 trading days. One thing that hasn’t changed: the deeply bearish trend for commodities in broad terms. The iPath Dow Jones-UBS Commodity Index Total Return ETN (NYSEARCA: DJP ) is still the big loser, shedding nearly 28% over the past year. Here’s a graphical recap of the relative performance histories for each of the major asset classes for the past 250 trading days via the ETF proxies. The chart below shows the performance records through June 12, 2015, with all the ETFs rebased to a year-ago starting-value of 100. U.S. equities are again in the lead (blue line at top), but the edge is razor thin over U.S. real estate investment trusts (black line), which is the number-two performer at the moment. Meanwhile, let’s review an ETF-based version of an unmanaged, market-value-weighted mix of all the major asset classes – the Global Market Index Fund, or GMI.F, which holds all the ETFs in the table above. Here’s how GMI.F stacks up for the past 250 trading days through June 12, 2015. This investable strategy is ahead by just 1.7% over that span – well below the performance for U.S. stocks, via the Vanguard Total Stock Market ETF (NYSEARCA: VTI ) and slightly behind the 2.0% return for U.S. bonds via the Vanguard Total Bond Market ETF (NYSEARCA: BND ). Comparing the median dispersion for rolling 250-day returns for the major asset classes via ETFs suggests that the general rebalancing opportunity has fallen for GMI.F vs. recent history after surging in recent months. Analyzing the components of GMI.F with a rolling median absolute deviation via one-year returns for the ETFs implies a moderately diminished potential for adding value by reweighting this portfolio in comparison with recent history. Keep in mind that the implied opportunity for productive rebalancing will vary depending on the choice of holdings and historical time window. Also, any given pair of ETFs may present a significantly greater or lesser degree of rebalancing opportunity vs. analyzing GMI.F’s components collectively, which is the methodology that’s reflected in the chart below. Note, too, that the chart focuses on looking backward. If you’re confident in your forecast for risk and return, the ex ante view of rebalancing opportunity may paint a distinctly different outlook vs. an ex post analysis. Finally, let’s compare the rolling one-year returns for the ETFs in GMI.F via boxplots to review performance momentum in the context of recent history. The gray boxes in the chart below reflect the middle range of historical 250-day returns for each ETF – the 25th to 75th return percentiles. The red dots show the current 250-day return (through June 12) vs. the equivalent from 30 trading days earlier (blue dots, which may be hiding behind red dots in some cases). For instance, the chart shows that the U.S. stock market is currently the top performer among the major asset classes, as shown by red dot. But in a sign of the times, the current performance is a touch below VTI’s median return (horizontal black line). Scalper1 News
Scalper1 News