Tag Archives: management

QGBR Is An Interesting ETF For Foreign Exposure
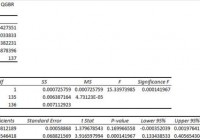
Summary I’m taking a look at QGBR as a candidate for inclusion in my ETF portfolio. The expense ratio relative to the diversification within the ETF is not very good. The extremely low correlation with other major funds (like SPY) is great, but is probably just the result of poor liquidity distorting trading data. Low volume makes commission free trading on the ETF a requirement to even consider it. I’m not assessing any tax impacts. Investors should check their own situation for tax exposure. Investors should be seeking to improve their risk adjusted returns. I’m a big fan of using ETFs to achieve the risk adjusted returns relative to the portfolios that a normal investor can generate for themselves after trading costs. I’m working on building a new portfolio and I’m going to be analyzing several of the ETFs that I am considering for my personal portfolio. One of the funds that I’m considering is the SPDR® MSCI United Kingdom Quality Mix ETF (NYSEARCA: QGBR ). I’ll be performing a substantial portion of my analysis along the lines of modern portfolio theory, so my goal is to find ways to minimize costs while achieving diversification to reduce my risk level. What does QGBR do? QGBR attempts to track the total return of the MSCI UK Quality Mix Index. Normally at least 80% of the assets are invested in funds included in this index, but there appears to be some leeway under unusual market conditions. QGBR falls under the category of “Miscellaneous Region”. Does QGBR provide diversification benefits to a portfolio? Each investor may hold a different portfolio, but I use (NYSEARCA: SPY ) as the basis for my analysis. I believe SPY, or another large cap U.S. fund with similar properties, represents the reasonable first step for many investors designing an ETF portfolio. Therefore, I start my diversification analysis by seeing how it works with SPY. I start with an ANOVA table: (click to enlarge) The correlation is only 32%, which is incredible for modern portfolio theory. Extremely low levels of correlation are wonderful for establishing a more stable portfolio. However, this may reflect the poor liquidity distorting the reported closing price. Standard deviation of daily returns (dividend adjusted, measured since June 2014) The standard deviation is fairly acceptable. For QGBR it is .8570%. For SPY, it is 0.7232% for the same period. SPY usually beats other ETFs in this regard, so that is not a major concern. Major risks The ETF suffers from absurdly low volume. The average volume at times is less than 500 shares per day, which is a major liquidity risk. Investors needing liquidity should avoid this risk. Going through the closing values on a day by day basis shows the problem is even worse. It was very common for the closing value to be identical for several days at a time. While it is possible that shares were traded at that price, it is also possible that this represents a day in which no shares traded hands. The resulting value for the daily return, 0.00%, could cause the standard deviation and correlation that are calculated to be substantially less than the real values. Investors need to be aware of this risk when considering the security. I plan to rebalance my ETF portfolio frequently, but the funds will be in a retirement portfolio that I will not have access to for a long time. Investors that need more liquid securities should avoid this market. Mixing it with SPY I also run comparisons on the standard deviation of daily returns for the portfolio assuming that the portfolio is combined with the S&P 500. For research, I assume daily rebalancing because it dramatically simplifies the math. With a 50/50 weighting in a portfolio holding only SPY and QGBR, the standard deviation of daily returns across the entire portfolio is 0.6429%. With 80% in SPY and 20% in QGBR, the standard deviation of the portfolio would have been .6538%. If an investor wanted to use QGBR as a supplement to their portfolio, the standard deviation across the portfolio with 95% in SPY and 5% in QGBR would have been .7019%. Why I use standard deviation of daily returns I don’t believe historical returns have predictive power for future returns, but I do believe historical values for standard deviations of returns relative to other ETFs have some predictive power on future risks and correlations. Yield & Taxes The SEC yield is 3.21%. That appears to be a very favorable yield. For retiring investors the yield may be tempting, but remember that this is not a very liquid security. I’m not a CPA or CFP, so I’m not assessing any tax impacts. Expense Ratio The ETF is posting .30% for an expense ratio. I want diversification, I want stability, and I don’t want to pay for them. The expense ratio on this fund is a tiny bit higher than I want to pay for equity securities, but not high enough to make me eliminate it from consideration. Market to NAV The ETF is at a .91% premium to NAV currently. Premiums or discounts to NAV can change very quickly so investors should check prior to putting in an order. I would only consider using this ETF with limit orders and no commissions on trading. Largest Holdings The diversification within the ETF is pretty bad. There were 7 companies that were each more than 3% of the total holdings. Diversification costs money. I want the expense ratio to be covering the costs of acquiring a more diverse set of securities. (click to enlarge) Conclusion I’m currently screening a large volume of ETFs for my own portfolio. The portfolio I’m building is through Schwab, so I’m able to trade QGBR with no commissions. I have a strong preference for researching ETFs that are free to trade in my account, so most of my research will be on ETFs that fall under the “ETF OneSource” program. I’m interested in QGBR because of the very low correlation, but I’ll need more data before I feel comfortable coming to a conclusion. My general premise at this point is that the stock is so absurdly illiquid that the statistics are substantially misleading it. I think investors should be very wary of buying into any assets with such a painfully low level of liquidity. Before investing, I would probably record the bid-ask spreads at several times throughout the day on several days and compare those values to the NAV at the end of the day. I might consider a small position in the ETF, but even with no liquidity needs I would want to make sure I didn’t get taken for a ride on the entry price. Additional disclosure: Information in this article represents the opinion of the analyst. All statements are represented as opinions, rather than facts, and should not be construed as advice to buy or sell a security. Ratings of “outperform” and “underperform” reflect the analyst’s estimation of a divergence between the market value for a security and the price that would be appropriate given the potential for risks and returns relative to other securities. The analyst does not know your particular objectives for returns or constraints upon investing. All investors are encouraged to do their own research before making any investment decision. Information is regularly obtained from Yahoo Finance, Google Finance, and SEC Database. If Yahoo, Google, or the SEC database contained faulty or old information it could be incorporated into my analysis. The analyst holds a diversified portfolio including mutual funds or index funds which may include a small long exposure to the stock.
Using ESG Screens For Utilities Stock Selection: American Electric Power Comes Out Ahead

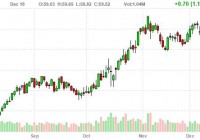
Summary AEP comes out as the top pick after fundamental analysis and ESG screening. AEP’s fundamental and ESG scores were impressive in comparison to the rest of the sector. Since August 2014, its stock has performed admirably. Environmental, social, and governance (ESG) screening strategies can find alpha in innovative companies. Utilities fit well into this analysis and screening methodology. Last July, while looking for an investment opportunity, I recalled New York City’s legendary summer blackouts. During those fateful evenings in August 1959, July 1977, and August 2003, the city’s electric utility, Con Edison, played a feature role in the events that were retold by patrons for decades. While Con Edison worked feverishly to restore power to the city, New Yorkers took off their shirts and wrung out their sweat-soaked handkerchiefs while sitting on their stoops, balconies, and porches waiting for a cool breeze from the East River. With this picture, I decided to explore the utilities sector for an investment opportunity. Utilities have been favored by investors for dividend yields and capital preservation. Many utilities are under-covered by securities analysts and as such, price discovery and liquidity are potentially hampered, creating potential long-term investment opportunities according to Target Rock Advisors, a socially responsible investing (SRI) consulting company focused on the utilities sector. I am an SRI champion so I began my sector analysis by applying an Environmental, Social, and Governance (ESG) screen. Afterwards, I look at fundamentals. Since I am investing for the long term and income, ESG screening is a sensible starting place. I used the Thomson Reuters Corporate Responsibility Ratings (TRCR) ESG Port for my first screen. The TRCR dataset allowed me to extract the U.S. utilities sector comprised of electric utilities, multiline utilities, natural gas utilities, and water & other utilities. My objective was to find the top performing utilities while applying an ESG tilt. The database is built to allow investment managers to select companies using a “best in class” measure, forgoing the alternative of ethical exclusions also called “negative screening”. This process presented me with the top ESG performers in the utilities sector. I retrieved 47 companies in all. Each company has four scores: an Environmental Score, a Social Score, a Corporate Governance score, and a composite ESG score which is the average of the three. The scores range from 1 to 100. Rather than simply ranking the companies by their composite ESG scores, I applied a weighted screen having greater leverage on the Social and Governance Pillars. Utilities are indubitably joined-up with environmental matters and actively comply with compulsory environmental regulations. To a large extent, utilities have recognized their environmental risks–so I reasoned that these risks have been priced into their stocks (with the exception of a “black swan” event). This relegated Environmental Scores to a lower weighting by my design. High Corporate Governance Scores are typically accepted as an indicator of strong corporate performance and lower risk since they are indicative of the company’s good management, strong board structure, as well as corporate charters and bylaws that are favorable to shareholders. Additionally, as a regulated industry, compulsory reporting assures transparency, another component of strong corporate governance scores. Clearly, “a strong governance rating would be a better long term indicator of stock market performance versus a strong environmental rating” according to Richard Rudden of Target Rock. Well managed companies have long term horizons that bode well for economic sustainability. A utility’s Social Score is perhaps the most revealing ESG indicator and the best place to look for an investment advantage, assuming that there is an accompanying strong corporate governance score. Social scores have key performance indicators for Employment Quality, Health & Safety, Training & Development, Diversity, Human Rights, Product Responsibility and Community Involvement. In Target Rock Advisor’s words, “Utilities have an abiding interest in supporting local and regional health and economic development, since those areas represent their core markets.” In effect, utilities are joined by the hip to the markets that they serve. Economic Analysis The final decision comes after a proper economic analysis. To do this I used MarketGrade.com’s StockGrader tool. StockGrader applies a fundamental analysis to companies and grades them in a range of 1 to 100. It uses technology to analyze a public company’s financial statement and presents the results in a user-friendly format. According to StockGrader, AEP distributed dividends uninterrupted for at least five years and based on the latest payout the stock was yielding 3.80%. The company was showing accelerating margin growth over the last three quarters and profits grew very strongly from the previous quarter compared to a year prior plus full year net income showed healthy gains from three years ago. Their latest report also showed a remarkable 20.68% increase from its total sales recorded during the same quarter last year. From a valuation perspective, the company’s current market value is only 1.56 times its tangible book value, which excludes intangible assets such as goodwill. This, according to StockGrader means investors are currently assigning very little value to the company’s ongoing business and that its future earnings growth when combined with AEP’s market cap of $25.53 billion (which is only 7.31 times larger than its latest quarterly net income plus depreciation), seems like an attractive valuation. My Analysis Steps Here is an outline of my analysis. 1. Create a portfolio of companies in the utilities sector with Thomson Reuters Corporate Responsibility Ratings (TRCR). 2. Screen for the top performers in the Social pillar with TRCR. Tag the top ten performers. 3. Screen for the top performers in the Governance pillar with TRCR. Tag the top ten performers. 4. Identify the companies that are in both top ten performer groups. This revealed the following companies: American Water Works (NYSE: AWK ) Xcel Energy (NYSE: XEL ) Exelon Corp. (NYSE: EXC ) American Electric Power (NYSE: AEP ) 5. Access StockGrader for economic ratings as a method of performing my fundamental analysis. 6. Select the company that presents the best combination of these metrics. Top Companies Scoring Table Company EN Rating SO Rating CG Rating ESG Rating ESG Rank Market Grader Rating Market Grader Action American Water Works Company Inc 63.4 66.2 73.7 67.8 86.3 49.7 Sell Xcel Energy Inc 70.0 70.7 72.9 71.2 91.4 43.8 Sell Exelon Corporation 70.6 78.0 71.8 73.4 94.4 37.0 Sell American Electric Power Company 77.3 73.5 71.7 74.2 95.0 55.5 Hold American Electric Power Company Inc. My analysis resulted in the choice of American Electric Power Company Inc. AEP has been recognized within corporate social responsibility circles as an example of a good corporate citizen. Its fundamentals were impressive in comparison to the rest of the sector and made for a good economic selection. Since August 2014, its stock has performed admirably. A chart of AEP follows. (click to enlarge)

An ETF Portfolio Yielding 9%

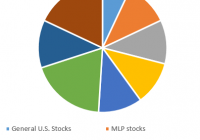
Summary The ETF Portfolio yielded 9% with a relatively low volatility. Over the past 3 years, the ETF Portfolio outperformed high yield bonds on a risk-adjusted basis. Over the past 3 years, the ETF Portfolio under-performed the S&P 500 on a risk-adjusted basis. January is a traditional time to reassess the markets and position your portfolio for the New Year As a retiree, I am continually looking for sources of high income, but I also don’t want to court excessive risk. I recently wrote an article on constructing a high income, lower risk, CEF portfolio for 2015. This article will attempt to construct a similar portfolio using Exchange Traded Funds (ETFs) that provides high yields at a reasonable risk. My first step was to screen the ETF database for high yielding funds. I used the FinViz website and selected 6% as the minimum yield. This is a high bar for an ETF, which does not use leverage and usually tracks a passive index. There were only 20 ETFs that satisfied the 6% yield criteria. I wanted the ETFs to be relatively liquid, so I also required that the fund have an average volume of at least 50,000 shares per day. Eighteen ETFs passed both screens, but many of these had been recently launched, so I narrowed the field by requiring at least a 3 year history. I would have preferred a longer history, but 3 years seemed to a good compromise. The 9 ETFs summarized below passed all my criteria. The quoted yields were sourced from Morningstar and the holdings were sourced from ETFdb . Alerian MLP (NYSEARCA: AMLP ). The ETF tracks the Alerian MLP Infrastructure Index, which tracks 25 energy infrastructure Master Limited Partnership [MLP] firms. This is one of the fastest growing MLP funds. It issue a standard 1099 at tax time rather than the more complex K-1 forms usually associated with partnerships. The ETF is structured as a C-corporation rather than as a Regulated Investment Company [RIC], because a RIC is prohibited from having more than 25% of the portfolio in MLPs. As a C-corporation, AMLP may invest exclusively in MLPs, but must also pay corporate income tax. This is the reason for the high expense ratio of 8.56% (the management fee is only 0.85%). This fund does however yield 6.46%, which is better than most other MLP ETFs. E-TRACS Wells Fargo Business Development Company Index (NYSEARCA: BDCS ). This is an ETN that tracks the Wells Fargo Business Development Company [BDC] Index, which tracks 114 BDCs selected from the NYSE and Nasdaq. BDCs obtain high yields by lending money to small and midsized businesses. BDCs may also take an active equity stake in some of the companies. This fund has an expense ratio of 0.85% and yields 8.18%. iShares MSCI United Kingdom (NYSEARCA: EWU ). This ETF tracks the MSCI United Kingdom Index, which measures the performance of the British market for large and midsized companies. The fund objective is to provide exposure to 85% of the UK stock market. The portfolio is allocated to sectors as follows: 21% in financials, 17% in energy, 16% in consumer stables, 9% in materials, 9% in healthcare, and 8% in consumer discretionary. The remaining 20% of the portfolio is spread over other sectors. The fund has an expense ratio of 0.48% and yields 7.51%. Peritus High Yield (NYSEARCA: HYLD ). This ETF is not linked to a specific benchmark. The portfolio holds 75 securities, with 4% in U.S. stocks, 4% in international stocks, and 92% in bonds (65% in U.S bonds with the other 27% in international bonds). All the bonds are below investment grade, with the majority invested in corporate bonds. The fund has an expense ratio of 1.18% and yields 9.66%. iShares Global Telecom (NYSEARCA: IXP ). This ETF seeks to match the performance of the S&P Global 1200 Telecommunications Sector Index. The fund contains 46 companies in the telecommunications sector. About 34% of the holdings are domiciled in the U.S. with the rest primarily spread across companies in Europe, Japan, and Canada. About 75% of the companies are diversified telecommunication services with the other 25% are focused on wireless services. Almost all (97%) are from large-cap to giant companies, and the top ten holdings make up 70% of the total assets. The expense ratio is 0.48% and the yield is a whopping 12.32%. KB High Dividend Yield Financial Portfolio (NYSEARCA: KBWD ). This ETF utilizes a dividend-weighted methodology to track companies in the financial and real estate sectors. The portfolio consists of 38 firms with 56% in financial services and 42% in real estate. All companies are domiciled in the U.S and most have small to medium market capitalizations. The fund has an expense ratio of 1.55% and yields 8.3%. CEF Income Composite Portfolio (NYSEARCA: PCEF ) . This ETF is intended to provide a means for investors to track a global index of closed end funds (CEFs). The portfolio consists of 149 CEFs, with a composite asset allocation of 19% U.S stocks, 5% international stocks, 69% bonds (about two thirds domestic and one third international), and 7% preferred stocks. The bond portfolio is almost all investment grade. The fund has an expense ratio of 1.77% and yields 8.02%. iShares U.S. Preferred Stock (NYSEARCA: PFF ). This ETF holds a portfolio of 284 preferred stocks, each of which have a market cap of at least $100 million and have at least 12 months to maturity. About 87% of the portfolio are stocks from financial firms (banks, insurance, and real estate). About 63% of the holdings are rated BBB or better. The fund has an expense ratio of 0.47% and yield 6.33%. i Shares Mortgage Real Estate Capped (NYSEARCA: REM ). This ETF tracks the FTSE NAREIT All Mortgage Capped Index. This fund has 39 holdings with the top 10 comprising about 68% of the assets. Most of the holdings are either medium or small capitalization. The fund is capped so that no company can constitute more than 25% of the portfolio. The fund has an expense ratio of 0.48% and yields a spectacular 14.5%. Reference ETFs To compare this portfolio to the general stock market and to other high-yielding assets, I included the following two funds for reference: iShares iBoxx $ High Yield Corporate Bonds (NYSEARCA: HYG ) . This ETF tracks the high yield corporate bond market and has a portfolio of about 1000 bonds. It has an expense ratio of 0.50% and yields 5.7%. I understand that this bond fund is not a good benchmark for equities, but it does provide an alternative for many investors seeking yield. SPDR S&P 500 (NYSEARCA: SPY ). This ETF tracks the S&P 500, so it is a good proxy for the equity stock market. It has an expense ratio of 0.09% and yields 1.9%. ETF Composite Portfolio If you equal weight the selected ETFs, the allocations for the composite portfolio are shown graphically in Figure 1. Numerically, the allocations are: 7% for general U.S stocks, 11% for MLPs, 11% for business development firms, 11% for companies specialized in mortgage REITs, 11% for companies in the financial sector, 19% international stocks, 12% preferred stocks, and 18% bonds. Summing these individual allocations gives an overall mix of about 70% equities, 12% preferred stocks, and 18% bonds. Figure 1 Composition of ETF Portfolio The composite portfolio has an average distribution of 9%, which certainly meets my criteria for high income. But total return and risk are as important to me as income, so I plotted the annualized rate of return in excess of the risk free rate (called Excess Mu in the charts) versus the volatility for each of the component funds. I used a look-back period from January, 2012 to January, 2015, a period of 3 years. The Smartfolio 3 program was used to generate this plot that is shown in Figure 2. (click to enlarge) Figure 2. ETF Portfolio risks versus rewards (3 years) The plot illustrates that these high yielding ETFs have booked a wide range of returns and volatilities over the past 3 years. To better assess the relative performance of these funds, I calculated the Sharpe Ratio. The Sharpe Ratio is a metric developed by Nobel laureate William Sharpe that measures risk-adjusted performance. It is calculated as the ratio of the excess return over the volatility. This reward-to-risk ratio (assuming that risk is measured by volatility) is a good way to compare peers to assess if higher returns are due to superior investment performance or from taking additional risk. In Figure 2, I plotted a red line that represents the Sharpe Ratio associated with HYG, the high yield bond ETF. If an asset is above the line, it has a higher Sharpe Ratio than HYG. Conversely, if an asset is below the line, the reward-to-risk is worse than HYG. Similarly, the blue line represents the Sharpe Ratio associated with SPY. Some interesting observations are evident from the plot. With the exception of preferred stocks, all the other ETFs were more volatile than the high yield bond fund. Most of the ETFs were less volatile than the S&P 500. However, business development firms, mortgage REITs, and United Kingdom stocks were slightly more volatile. Over the last 3 years, the S&P 500 has been in a strong bull market. Thus, it is not surprising that the total return associated with SPY was substantially greater than any of the other funds in the analysis. On a risk-adjusted basis, only preferred stocks were able to keep pace with SPY. On a risk adjusted basis, high yield bonds performed well compared to the other high yielding ETFs. Only three of the ETFs (PFF, PCEF, and KBWD) outperformed HYG. Most of the other ETFs were below but close to the “red line”. The exceptions were HYLD and EWU, both of which lagged in performance. Somewhat surprising, HYG outperformed HYLD on both an absolute and risk-adjusted basis. When I combined the high yielding ETFs into an equally weighted portfolio, the composite portfolio had a reasonably good return with a relatively low volatility. The risk and reward associated with this composite portfolio are denoted by the yellow dot on the figure. This is an illustration of an amazing discovery made by an economist named Markowitz in 1950. He found that if you combined certain types of risky assets, you could construct a portfolio that had less risk than the components. His work was so revolutionary that he was awarded the Nobel Prize. The key to constructing such a portfolio was to select components that were not highly correlated with one another. In other words, the more diversified the portfolio, the more potential volatility reduction you can receive. To be “diversified,” you want to choose assets such that when some assets are down, others are up. In mathematical terms, you want to select assets that are uncorrelated (or at least not highly correlated) with each other. I calculated the pair-wise correlations associated with the funds. I also included SPY to assess the correlation of the funds with the S&P 500 and HYG to check the correlations with high yield bonds. The data is presented in Figure 3. As you might expect, the equity funds were the most correlated with SPY (correlations in the 50% to 80% range). Mortgage REITs and high yield bonds had smaller correlations with SPY. It is interesting that HYLD and HYG were only 53% correlated. It should also be noted that HYG was 68% correlated with SPY, which is consistent with the idea that high yield bonds typically respond similar to equities. Overall, these results were consistent with a well-diversified portfolio. (click to enlarge) Figure 3. Correlations over past 3 year. Bottom Line As seen from Figure 2, the ETF composite portfolio returned more than HYG, but had a higher volatility than high yield bonds. The reverse was true when compared to S&P 500. The ETF portfolio had lower volatility, but also had significantly less return. On a risk adjusted basis, the ETF portfolio outperformed high yield bonds but underperformed the S&P 500. If you had decided to invest in ETF portfolio in January, 2012, Figure 4 provides a graphic of how your wealth would have increased. This plot assumes that the portfolio is re-balanced frequently in order to maintain the equal weighting over the look-back period. The figure indicates a relatively smooth accumulation of wealth with a few periods of sharp draw-downs. (click to enlarge) Figure 4 ETF Portfolio wealth growth Figure 5 focuses on the potential draw-downs on the past 3 years. The draw-downs were typically relatively small (less than 6%). Over the period of the analysis, there were only 2 instances where the draw-downs exceeded 7%. The largest drawdown occurred late last year when the portfolio lost over 9%. (click to enlarge) Figure 5 ETF Portfolio wealth draw-downs. No one knows how this portfolio will perform in the future, but based on past history, if you are a risk adverse investor looking for income, the ETF portfolio may be worthy of consideration. It outperformed the reference high yield bond fund on a risk-adjusted basis and also provided significantly higher income. On the other hand, if you can handle more risk, the S&P 500 was hard to beat in terms of total return.