Scalper1 News
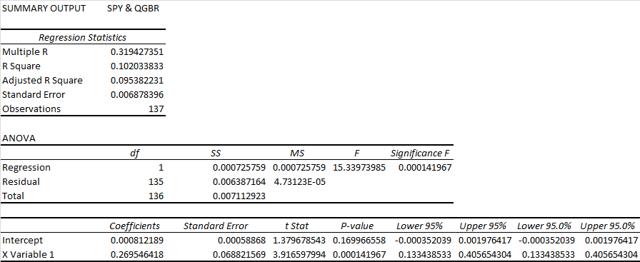
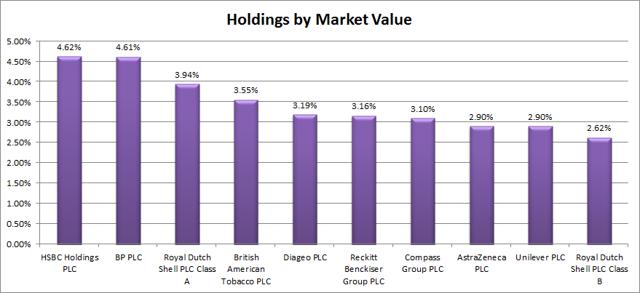 Summary I’m taking a look at QGBR as a candidate for inclusion in my ETF portfolio. The expense ratio relative to the diversification within the ETF is not very good. The extremely low correlation with other major funds (like SPY) is great, but is probably just the result of poor liquidity distorting trading data. Low volume makes commission free trading on the ETF a requirement to even consider it. I’m not assessing any tax impacts. Investors should check their own situation for tax exposure. Investors should be seeking to improve their risk adjusted returns. I’m a big fan of using ETFs to achieve the risk adjusted returns relative to the portfolios that a normal investor can generate for themselves after trading costs. I’m working on building a new portfolio and I’m going to be analyzing several of the ETFs that I am considering for my personal portfolio. One of the funds that I’m considering is the SPDR® MSCI United Kingdom Quality Mix ETF (NYSEARCA: QGBR ). I’ll be performing a substantial portion of my analysis along the lines of modern portfolio theory, so my goal is to find ways to minimize costs while achieving diversification to reduce my risk level. What does QGBR do? QGBR attempts to track the total return of the MSCI UK Quality Mix Index. Normally at least 80% of the assets are invested in funds included in this index, but there appears to be some leeway under unusual market conditions. QGBR falls under the category of “Miscellaneous Region”. Does QGBR provide diversification benefits to a portfolio? Each investor may hold a different portfolio, but I use (NYSEARCA: SPY ) as the basis for my analysis. I believe SPY, or another large cap U.S. fund with similar properties, represents the reasonable first step for many investors designing an ETF portfolio. Therefore, I start my diversification analysis by seeing how it works with SPY. I start with an ANOVA table: (click to enlarge) The correlation is only 32%, which is incredible for modern portfolio theory. Extremely low levels of correlation are wonderful for establishing a more stable portfolio. However, this may reflect the poor liquidity distorting the reported closing price. Standard deviation of daily returns (dividend adjusted, measured since June 2014) The standard deviation is fairly acceptable. For QGBR it is .8570%. For SPY, it is 0.7232% for the same period. SPY usually beats other ETFs in this regard, so that is not a major concern. Major risks The ETF suffers from absurdly low volume. The average volume at times is less than 500 shares per day, which is a major liquidity risk. Investors needing liquidity should avoid this risk. Going through the closing values on a day by day basis shows the problem is even worse. It was very common for the closing value to be identical for several days at a time. While it is possible that shares were traded at that price, it is also possible that this represents a day in which no shares traded hands. The resulting value for the daily return, 0.00%, could cause the standard deviation and correlation that are calculated to be substantially less than the real values. Investors need to be aware of this risk when considering the security. I plan to rebalance my ETF portfolio frequently, but the funds will be in a retirement portfolio that I will not have access to for a long time. Investors that need more liquid securities should avoid this market. Mixing it with SPY I also run comparisons on the standard deviation of daily returns for the portfolio assuming that the portfolio is combined with the S&P 500. For research, I assume daily rebalancing because it dramatically simplifies the math. With a 50/50 weighting in a portfolio holding only SPY and QGBR, the standard deviation of daily returns across the entire portfolio is 0.6429%. With 80% in SPY and 20% in QGBR, the standard deviation of the portfolio would have been .6538%. If an investor wanted to use QGBR as a supplement to their portfolio, the standard deviation across the portfolio with 95% in SPY and 5% in QGBR would have been .7019%. Why I use standard deviation of daily returns I don’t believe historical returns have predictive power for future returns, but I do believe historical values for standard deviations of returns relative to other ETFs have some predictive power on future risks and correlations. Yield & Taxes The SEC yield is 3.21%. That appears to be a very favorable yield. For retiring investors the yield may be tempting, but remember that this is not a very liquid security. I’m not a CPA or CFP, so I’m not assessing any tax impacts. Expense Ratio The ETF is posting .30% for an expense ratio. I want diversification, I want stability, and I don’t want to pay for them. The expense ratio on this fund is a tiny bit higher than I want to pay for equity securities, but not high enough to make me eliminate it from consideration. Market to NAV The ETF is at a .91% premium to NAV currently. Premiums or discounts to NAV can change very quickly so investors should check prior to putting in an order. I would only consider using this ETF with limit orders and no commissions on trading. Largest Holdings The diversification within the ETF is pretty bad. There were 7 companies that were each more than 3% of the total holdings. Diversification costs money. I want the expense ratio to be covering the costs of acquiring a more diverse set of securities. (click to enlarge) Conclusion I’m currently screening a large volume of ETFs for my own portfolio. The portfolio I’m building is through Schwab, so I’m able to trade QGBR with no commissions. I have a strong preference for researching ETFs that are free to trade in my account, so most of my research will be on ETFs that fall under the “ETF OneSource” program. I’m interested in QGBR because of the very low correlation, but I’ll need more data before I feel comfortable coming to a conclusion. My general premise at this point is that the stock is so absurdly illiquid that the statistics are substantially misleading it. I think investors should be very wary of buying into any assets with such a painfully low level of liquidity. Before investing, I would probably record the bid-ask spreads at several times throughout the day on several days and compare those values to the NAV at the end of the day. I might consider a small position in the ETF, but even with no liquidity needs I would want to make sure I didn’t get taken for a ride on the entry price. Additional disclosure: Information in this article represents the opinion of the analyst. All statements are represented as opinions, rather than facts, and should not be construed as advice to buy or sell a security. Ratings of “outperform” and “underperform” reflect the analyst’s estimation of a divergence between the market value for a security and the price that would be appropriate given the potential for risks and returns relative to other securities. The analyst does not know your particular objectives for returns or constraints upon investing. All investors are encouraged to do their own research before making any investment decision. Information is regularly obtained from Yahoo Finance, Google Finance, and SEC Database. If Yahoo, Google, or the SEC database contained faulty or old information it could be incorporated into my analysis. The analyst holds a diversified portfolio including mutual funds or index funds which may include a small long exposure to the stock. Scalper1 News
Scalper1 News