Tag Archives: management

Where Is The Market Going? Separating The Signal From The Noise

No one “knows” where the market will close tomorrow, let alone this year. That doesn’t stop gurus, seers, and writers from telling us which indicators will give us that inside edge. Read enough of them — or even two — and you realize you’re right back where you started. Instead, just concentrate on these important questions for your portfolio strategy. Journalists have to write x number of stories every week to fulfill their contracts. That doesn’t mean you have to read them and, if you still find amusement in so doing, it doesn’t mean you have to act on their advice. Thank heavens. Case in point. At 6:56 p.m. EST on January 6th, Mark Hulbert posted this piece on Marketwatch.com: “Opinion: A bear market in stocks just became more likely .” The gist of the article was summed up neatly in his first two sentences: “Bad news, investors: The Dow Industrials’ 300-plus-point drop Monday markedly increases the likelihood that the bull market has neared its end – if it hasn’t already. That’s because the stock market’s performance in the first two trading days of January has a surprisingly good record of forecasting the direction for the next 12 months.” Mr. Hulbert goes on to describe his pleasure at discovering this new tool, which is even better, he believes, than using the first five days of January as a tool to decide whether to consider investing for the year, and to note that the 1.8% decline in the first two trading days of 2015 were “even bigger than the 1.6% decline the Dow posted over the first two days of 2008, a fateful year that would later experience the worst bear market since the 1930s.” Give’s one pause, doesn’t it? Ah, but hot on the trail of this article comes one the very next day from Reuters titled, ” Here’s What Happened Those Other Times The S&P 500 Started the Year With 3 Down Days. ” The distinction is important, you see – this “indicator” uses the first three days of the new year, not merely the first two. Reuters’ Myles Udland reports on an e-mail sent by Jonathan Krinsky of MKM Partners that says, “During the eight years since 1928 that the S&P started with three-day losing streaks the index has returned 8.36% on average,” better than all years for the S&P since 1928. Well, there you have it. Since Mr. Hulbert’s data goes back to 1896 and Mr. Krinsky’s only until 1928, we are forced to draw one of two conclusions: There were a preponderance of less-than-pleasant market years prior to 1928 that began with 2 down days the first two trading days of the year, or It just doesn’t matter. I am firmly in the latter camp, call it the “Who Cares?” camp. What actionable offensive might an investor take armed with this information? I suppose if one were schizophrenic enough, they could have gone to cash after the second day and rushed back in the fourth day (after the “first 3 days” had passed.) But, really now, who makes their lifetime investing decisions like this? (I know, I know; more than I’d care to imagine.) Forget the First 2 Days / First 3 Days / First 5 Days Indicators and ask yourself this: Does the macro-economic and geopolitical environment favor the geographic and political regions in which you are investing? Are the sectors you favor undervalued or, if you anticipate superb results based on the first question, are they at least currently fairly valued? Do you currently have the appropriate mix of asset classes and individual funds, bonds and stocks to benefit from (or defend against) the market the first two questions lead you to invest in? Then, as the famous investment guru Aaron Rodgers recently said, “R-E-L-A-X.” Invest rationally. Read fewer articles written breathlessly about tea leaves, bones in a circle, or statistical correlation. There may be more kittens born in January than other months, too. Does that mean we should faithfully track the number of kittens born this month? Of course not; correlation does not mean causation. Sometimes it doesn’t mean anything at all… ________ As Registered Investment Advisors, we believe it is our responsibility to advise that we do not know your personal financial situation, so the information contained in this communiqué represents the opinions of the staff of Stanford Wealth Management, and should not be construed as personalized investment advice. Past performance is no guarantee of future results, rather an obvious statement but clearly too often unheeded judging by the number of investors who buy the current #1 mutual fund one year only to watch it plummet the following year. We encourage you to do your own due diligence on issues we discuss to see if they might be of value in your own investing. We take our responsibility to offer intelligent commentary seriously, but it should not be assumed that investing in any securities we are investing in will always be profitable. We do our best to get it right, and we “eat our own cooking,” but we could be wrong, hence our full disclosure as to whether we own or are buying the investments we write about.
NUO Offers Some Decent Yields, But I Have Several Concerns About It

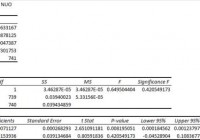
Summary I’m taking a look at NUO as a candidate for inclusion in my ETF portfolio. I don’t like the expense ratio. The correlation to SPY is almost nothing and it is based on reasonable trade volumes. The credit ratings of the portfolio seem fine, but the high duration and persistent discount to NAV concern me. I’m not assessing any tax impacts. Investors should check their own situation for tax exposure. Investors should be seeking to improve their risk adjusted returns. I’m a big fan of using ETFs to achieve the risk adjusted returns relative to the portfolios that a normal investor can generate for themselves after trading costs. I’m working on building a new portfolio and I’m going to be analyzing several of the ETFs that I am considering for my personal portfolio. One of the funds that I’m considering is the Nuveen Ohio Quality Income Municipal Fund (NYSE: NUO ). I’ll be performing a substantial portion of my analysis along the lines of modern portfolio theory, so my goal is to find ways to minimize costs while achieving diversification to reduce my risk level. What does NUO do? NUO attempts to provide current income that is exempted from regular federal and Ohio income tax. At least 80% of the assets are invested in investment grade municipal bonds. The other 20% may be invested in bonds that are not rated if the investment adviser believes their characteristics are similar to those of investment grade municipal bonds. NUO falls under the category of “Muni Ohio.” Does NUO provide diversification benefits to a portfolio? Each investor may hold a different portfolio, but I use the SPDR S&P 500 Trust ETF (NYSEARCA: SPY ) as the basis for my analysis. I believe SPY, or another large cap U.S. fund with similar properties, represents the reasonable first step for many investors designing an ETF portfolio. Therefore, I start my diversification analysis by seeing how it works with SPY. I start with an ANOVA table: (click to enlarge) The correlation is beautiful at 3%. Extremely low levels of correlation are wonderful for establishing a more stable portfolio. For equity securities an extremely low correlation is frequently only found when there are substantial issues with trading volumes that may distort the statistics. Bonds should have dramatically lower levels of correlation, but I’m still quite happy with this. NUO is an ETF that is heavily invested in bonds, so the low correlation for it should be less surprising than a similar correlation from an ETF that is invested in equity. Standard deviation of daily returns (dividend adjusted, measured since January 2012) The standard deviation is .6859% for NUO. For SPY, it is .7300% for the same period. SPY usually beats other ETFs in this regard. However, I would have hoped for a little less volatility. The real test for a bond portfolio is looking at the duration and seeing how vulnerable it is to changes in interest rates. Liquidity looks acceptable Average trading volume isn’t very high, a bit over 22,000, but that also isn’t low enough to be a major concern for me. It is higher than I had expected when I saw the low correlation and saw that the bond was being designed for tax exemption for a single state. I thought liquidity might be weaker because of the more specialized nature of the ETF, but it isn’t too bad in my opinion. In my sample period of nearly 3 years, there were no days in which the dividend adjusted close was exactly equal to the value it had on the previous day. The lack of days with no change suggests that low liquidity is not driving the low correlation. Mixing it with SPY I also run comparisons on the standard deviation of daily returns for the portfolio assuming that the portfolio is combined with the S&P 500. For research, I assume daily rebalancing because it dramatically simplifies the math. With a 50/50 weighting in a portfolio holding only SPY and NUO, the standard deviation of daily returns across the entire portfolio is .5082%. With 80% in SPY and 20% in NUO, the standard deviation of the portfolio would have been .6038%. If an investor wanted to use NUO as a supplement to their portfolio, the standard deviation across the portfolio with 95% in SPY and 5% in NUO would have been .6954%. Why I use standard deviation of daily returns I don’t believe historical returns have predictive power for future returns, but I do believe historical values for standard deviations of returns relative to other ETFs have some predictive power on future risks and correlations. Yield & Taxes The distribution rate is 5.72%. This ETF could be worth considering for retiring investors. I like to see strong yields for retiring portfolios because I don’t want to touch the principal. By investing in ETFs I’m removing some of the human emotions, such as panic. Since this is an investment in bonds through an ETF, over the long term capital appreciation should not be expected. In my opinion, investing in SPY provides a reasonable level of dividend yield with a substantial amount of average appreciation over time. For a retiring investor, it may be desirable to have stronger yields at the cost of appreciation. One way to do that is to include some bond ETFs. I intend to include quite a few of them in my portfolio. The exposure level will probably be in the 20 to 30% range. Some advisors would suggest that I should have fewer bonds since I am so far away from retirement, but I believe the lower correlation makes it imperative to include at least a small bond position in reaching the efficient frontier. I’m not a CPA or CFP, so I’m not assessing any tax impacts. The description of the ETF states that it intends to produce income that is exempt from taxation in Ohio, but I am not qualified to determine if that goal is being met. The portfolio I am constructed will be in a tax advantaged account, so I am not concerned about avoiding taxes on interest, dividends, or gains. Expense Ratio The ETF is posting 2.15 % for a gross expense ratio, and 1.10% for a net expense ratio. I want diversification, I want stability, and I don’t want to pay for them. This is what I would consider an unattractive expense ratio. Market to NAV The ETF is at a 9.66% discount to NAV currently. Premiums or discounts to NAV can change very quickly so investors should check prior to putting in an order. Over the last month the average discount was 9.56% and over the last year it was 6.78%. I’m curious about the reason for that substantial discount. Normally I would expect fair market values for the individual investments used in calculating NAV, but I’m curious about this one. It may be fun to look for anything that would merit that discount. Credit Ratings The bond ratings aren’t too bad in my opinion, but I’m also currently holding a fund filled with junk bonds. Many readers may have much higher requirements for credit ratings when investing in debt. (click to enlarge) Conclusion I’m currently screening a large volume of ETFs for my own portfolio. The portfolio I’m building is through Schwab. I have a strong preference for researching ETFs that are free to trade in my account, so most of my research will be on ETFs that fall under the “ETF OneSource” program. I have not seen this ETF listed for the OneSource program. I love the correlation, but I’ll need to test the correlation with other bond ETFs as I work to select a batch of bond ETFs that are neither highly correlated to the market nor to each other. I do have a few major concerns here. The first is that I don’t want to give up any yield to acquire tax free status on bonds that are going into a tax advantaged account. The second is that the expense ratio feels really high. The third is that discount to NAV is both substantial and sustained, so I would want to find the cause of the discount. The fourth is that the average effective duration is 8.84 years. One of the reasons I use junk bonds is so I can acquire a respectable yield while maintaining a substantially lower duration. I’m not expecting NUO to make the final cut, but I’m going to keep on my list because I want to see how it performs relative to other bond ETFs in the portfolio simulations. Additional disclosure: Information in this article represents the opinion of the analyst. All statements are represented as opinions, rather than facts, and should not be construed as advice to buy or sell a security. Ratings of “outperform” and “underperform” reflect the analyst’s estimation of a divergence between the market value for a security and the price that would be appropriate given the potential for risks and returns relative to other securities. The analyst does not know your particular objectives for returns or constraints upon investing. All investors are encouraged to do their own research before making any investment decision. Information is regularly obtained from Yahoo Finance, Google Finance, and SEC Database. If Yahoo, Google, or the SEC database contained faulty or old information it could be incorporated into my analysis. The analyst holds a diversified portfolio including mutual funds or index funds which may include a small long exposure to the stock.

Can The Lift Of Sanctions Start The Growth Of The Russian Share Market?

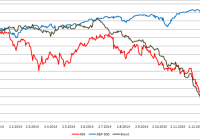
Summary The French president proclaimed that the sanctions against Russia should be lifted. The main problem of the Russian stock market is the collapse of oil prices right now. The investors shouldn’t expect that the end of sanctions will have a strong effect on the Market Vectors Russia ETF. The French president Francoise Hollande said that the sanctions against Russia should be lifted . The sanctions were imposed during 2014 in order to force Russia to not support the rebels in eastern Ukraine. The sanctions have limited the access of some of the biggest Russian companies to financial markets. But the real problem for the Russian economy and the Russian share market is the collapse of oil prices right now. The chart below shows the 2014 development of the Market Vectors Russia ETF (NYSEARCA: RSX ), S&P 500 and Brent valuations. As we can see RSX had very volatile first half of 2014. But it managed to recover most of the losses during May and June. The major decline has started in early July and it coincided with the start of the oil price collapse. Both of the curves are almost identical on the September-December time frame. (click to enlarge) Source: own processing The correlation coefficient between RSX and Brent was 0.866 in 2014. It was only 0.355 in the 1H 2014 but it rose to 0.96 in the 2H 2014, which means almost perfect positive correlation. The chart below shows 20-day moving correlation between RSX and Brent prices. It clearly shows that the huge decline of the RSX price is related to the oil price collapse more than to anything other. (click to enlarge) Source: own processing Yes, the sanctions are a complication for Gazprom ( OTCQX:GZPFY ), Sberbank ( OTCPK:SBRCY ), VTB or Rosneft ( OTC:RNFTF ). But the Western financial markets are not the only source of money. There is a country called China right to the south of Russia. And although China has some problems right now it still holds huge foreign currency reserves. Investing in Russia would help to diversify the Chinese reserves out of dollars and it would also help them to satisfy their long term appetite for natural resources. So yes, the sanctions are a complication for the Russian companies but it is nothing that should be able to endanger their existence and bring their share prices to the current levels. The ultimate problem is the collapse of oil prices. Conclusion The opinion of president Hollande is really positive and the sanctions should be definitely canceled. The European economy is impacted by the sanctions and anti-sanctions probably equally if not even more than the Russian economy. Also the situation in Ukraine has calmed down lately and the peace talks are underway. But if the sanctions will be or won’t be lifted, it will have only a limited impact on the Russian share market and on the price of RSX. All RSX needs to start growing is growth of the oil price and its stabilization somewhere over $80/barrel. I am sure that the oil price will return to the $100 level and above it but I don’t know whether it will be in 2015, 2016 or maybe in 2017. The big Russian companies will survive the waiting but they will not shine. This time period is a good opportunity to accumulate shares of selected companies and RSX. Now that you’ve read this, are you Bullish or Bearish on ? Bullish Bearish Sentiment on ( ) Thanks for sharing your thoughts. Why are you ? Submit & View Results Skip to results » Share this article with a colleague