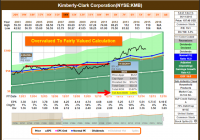
Summary Utility stocks have moved from overvaluation to undervaluation. Utility stocks are attractive for their safety and high current yield. Utility stocks can be used to increase a portfolio’s yield or defensively in lieu of holding cash. To get a free, more detailed perspective on utility stocks, follow this direct link to a video on my site mistervaluation.com and watch and listen to me analyze these companies out loud via the FAST Graphs fundamentals analyzer software tool. Introduction It is no secret that the stock market in the general sense is trading at a higher valuation than normal. On the other hand, I would argue that it’s far from bubble territory. Regardless, I must admit that finding attractive valuations is getting harder with each passing day. This is especially true for the conservative retired investor looking for safe sources of income in order to fund their golden years. But, at the same time, that does not mean that good value or sound investments cannot be found. In the same vein, many, if not most, of the best-of-breed blue-chip dividend growth stocks are also now fully valued. However, it’s important to point out that fully valued does not mean the same thing as dangerously overvalued. Instead, it implies that many of our best dividend growth stocks are not bargains today. For example, quality blue chips like Procter & Gamble (NYSE: PG ) or Kimberly-Clark (NYSE: KMB ) offer dividend yields in excess of 3%, which is reasonably attractive given the current low interest rate environment. The fact that both of those names are Dividend Champions and/or Aristocrats suggest that future dividend increases can also be rationally expected. However, since both of these names are trading at above-average premium valuations, it also indicates higher-than-normal risk and perhaps less than historical normal total return opportunities. To illustrate my point, I offer the following earnings and price correlated F.A.S.T. Graphs on Kimberly-Clark since 2003. Utilizing the calculating feature of the research tool, I chose a point (May 28, 2004) where Kimberly-Clark was trading at approximately the same P/E ratio of 19, as it does today. Then, I ran my calculation out to a future point in time when Kimberly-Clark was trading at a fair value P/E ratio of approximately 15 (November 30, 2011) which I contend is inevitable. The total annualized rate of return of 3.96%, although positive, is not necessarily enticing. (click to enlarge) Then, in order to emphasize the value and importance of fair valuation, I conducted a second calculation exercise. Only this time, I waited until a time when Kimberly-Clark’s stock price had, in fact, moved into fair valuation territory (October 31, 2005) and then calculated the return up to the same future point when the company was again at fair valuation (November 30, 2011). The result of investing when fair value was present generated a 7% total annualized return, which is reasonable and acceptable for this high-quality blue-chip. However, there are interesting points to consider and learn from conducting this exercise. Although waiting for fair value to manifest before I invested significantly increased my total annualized return, it simultaneously meant forgoing a couple of dollars per share of dividend income. On the other hand, this exercise illustrated that by being diligent about fair valuation I would have increased my annualized return while simultaneously reducing my risk. The importance of investing only when fair valuation is present should not be disregarded or overlooked. (click to enlarge) Regular readers of my work will attest to the fact that I believe it’s a market of stocks and not a stock market. Therefore, even though I have postulated the notion that the stock market in the general sense, and blue-chip dividend stocks in particular, are currently fully valued to moderately overvalued, that is not to say that all stocks or all sectors are also overvalued. The remainder of this article will offer a look at five high-quality utility stocks that were recently overvalued but have since come into fair valuation territory. Utilities High Yield and Fair Valuation In the introduction I alluded to the fact that I believe common stocks will inevitably move to fair valuation. Modern finance theory would like us to believe that the market is efficient and, therefore, that stocks are always being priced properly. I disagree with that theory, but not totally. Instead of the market always being efficient, I believe that it is always seeking efficiency. In other words, stocks do become improperly priced from time to time, however, they will inevitably move into alignment with fair value in the longer run. This works the same if the market is overvaluing companies as it does if it is undervaluing companies. The utility sector represents a current case in point. From approximately the fall of 2014 through the spring of 2015, utility stocks became moderately overvalued to a similar extent that we currently see with the Kimberly-Clark example above. However, most utility stocks peaked in January, and over the course of the rest of this year, the average utility stock has fallen approximately 15% to 20% off of their highs. Unfortunately, there are many investors that would consider the utility sector’s recent poor performance a negative and look elsewhere. In contrast, I see the utility sector’s recent poor performance as the inevitable process of the market seeking efficiency and see opportunity. Stated more directly, this low-growth but high-yielding sector has gone from being previously unattractive to currently being fairly valued and attractive. Where others see risk, I now see opportunity. Utility Stocks: Sometimes the Best Offense Is a Good Defense There are a couple of facts regarding investing in utility stocks that I would like to simply mention here, and elaborate more on later in the article with specific examples. First and foremost, almost by definition utility stocks tend to have very low historical rates of earnings growth. Therefore, if bought at fair valuation, the capital appreciation component for the long-term buy-and-hold investor will correlate very closely to the company’s rate of change of earnings growth. Consequently, there is not much of a margin for error because even a modest amount of overvaluation can significantly lower or even negate any potential future capital appreciation. Additionally, current yield will be lessened, and risk increased if you overpay for a utility stock even by just a little bit. As previously mentioned, this was the case for utility stocks just a few short months ago, but not anymore. The common view about dividend-paying utility stocks, which I personally share, is that they are high-yielding stable investments with predictable earnings and low volatility. Therefore, utility stocks have long been considered a safe sector. However, it is worth repeating that utility stocks are by their nature not high total return investments. Instead, investors are usually attracted to utility stocks for their above-average current yields, consistent operating results and relative safety. In other words, investors should expect utility stocks to be defensive and stable investments that have consistent earnings growth and offer above-average dividend yield. With attractive value so hard to find today, this makes fairly-valued, high-quality utility stocks worth considering. 5 High Quality, High Yielding, Defensive Utility Stocks for Today’s Uncertain Market When your investing objective is for income, as is the case for many investors in retirement, generating the highest possible total return is not the highest priority. The more prudent focus turns to preserving your capital while generating an attractive level of spendable income. This is a primary reason why investors have traditionally chosen bonds and other fixed income instruments. When interest rates are at more historically normal levels than they currently are, fixed income investments would typically offer a current yield advantage over equities coupled with a higher degree of safety. Unfortunately, that is not the case today. The only way to earn an interest rate that is competitive with the current dividend yield of utility stocks is to either invest in extremely long-term bonds, or invest in lower-quality instruments. That strategy actually negates the traditional benefit the fixed income should offer. In my opinion, in the current low interest rate environment, high-quality utility stocks provide a bridge of sorts. High-quality utility stocks offer more safety than is found with the typical equity, and current yields that are customarily associated with fixed income. Consequently, I believe that carefully selected utility stocks available at sound valuations can provide viable investment options for investors in retirement and in need of income. With this article, I offer five high-quality utility stock candidates that prudent income-seeking investors with fresh capital to invest might consider. My selection process was straightforward. Each candidate had to have a credit rating of BBB+ or higher, a dividend yield in excess of 4%, and a P/E ratio between 14 to 16. Four of these candidates meet those criteria perfectly. However, as I will discuss later, my favorite utility, Wisconsin Electric, is currently at a P/E ratio of approximately 17 and its dividend yield is 3.7%. However, I included it because it has historically been one of the most consistent and fast-growing utilities in the country. To get a free more detailed perspective on utility stocks, follow this direct link to a video on my site mistervaluation.com and watch and listen to me analyze these companies out loud via the FAST Graphs fundamentals analyzer software tool. Consolidated Edison, Inc. (NYSE: ED ) Short business description, courtesy S&P Capital IQ: “Consolidated Edison, Inc., through its subsidiaries, engages in regulated electric, gas, and steam delivery businesses in the United States. It offers electric services to approximately 3.4 million customers in New York City and Westchester County; gas to approximately 1.1 million customers in Manhattan, the Bronx, and parts of Queens and Westchester County; and steam to approximately 1,700 customers in parts of Manhattan. The company owns 62 area distribution substations and various distribution facilities; 39 transmission substations and 62 area stations; electric generation facilities with an aggregate capacity of 705 megawatts that run with gas and fuel oil; 4,330 miles of mains and 369,339 service lines for natural gas distribution; and 1 steam-electric generating station and 5 steam-only generating stations. It also supplies electricity to approximately 0.3 million customers in southeastern New York, and in adjacent areas of northern New Jersey and northeastern Pennsylvania; and gas to approximately 0.1 million customers in southeastern New York and adjacent areas of northeastern Pennsylvania. The company operates 572 circuit miles of transmission lines; 14 transmission substations; 62 distribution substations; 86,379 in-service line transformers; 3,991 pole miles of overhead distribution lines; and 1,869 miles of underground distribution lines, as well as 1,867 miles of mains and 105,077 service lines for natural gas distribution. In addition, it is involved in the sale and related hedging of electricity to retail customers; and provision of energy-related products and services to wholesale and retail customers. Further, the company develops, owns, and operates renewable and energy infrastructure projects, as well as invests in transmission companies. It primarily sells electricity to industrial, commercial, residential, and governmental customers. The company was founded in 1884 and is based in New York, New York.” Consolidated Edison is attractively valued at a blended P/E ratio of 14.8 and offers a dividend yield of 4.5%. Since the beginning of 2015, Consolidated Edison’s stock price has inevitably moved from moderate overvaluation to its current fair valuation level. (click to enlarge) It should be no surprise that when reviewing the performance of Consolidated Edison relative to the S&P 500 that the index outperforms on a total return basis. However, as previously discussed, the attractiveness of utilities comes from their relative safety and superior dividend income-producing ability. Therefore, I direct the reader’s attention to the cumulative total dividend income advantage of Consolidated Edison over the S&P 500. (click to enlarge) Since the primary attraction of investing in utility stocks is for their safety and high dividend income, each candidate’s ability to support their dividend is of paramount importance. The following FUN Graph (fundamental underlying numbers) reflects revenues per share (revps), cash flow per share (cflps) and dividends paid per share (dvpps). Clearly, dividend coverage is supported by revenues and cash flows. (click to enlarge) SCANA Corporation (NYSE: SCG ) Short business description, courtesy S&P Capital IQ: “SCANA Corporation, through its subsidiaries, engages in the generation, transmission, distribution, and sale of electricity to retail and wholesale customers in South Carolina. It owns nuclear, coal, hydro, natural gas and oil, and biomass generating facilities. The company also purchases, sells, and transports natural gas; offers energy-related services; and owns and operates a fiber optic telecommunications network, ethernet network, and data center facilities in South Carolina. In addition, it offers tower site construction, management, and rental services, as well as sells towers in South Carolina, North Carolina, and Tennessee. As of December 31, 2014, the company supplied electricity to approximately 688,000 customers; and provided natural gas to approximately 859,000 residential, commercial, and industrial customers in North Carolina and South Carolina, as well as markets natural gas to approximately 459,000 customers in Georgia. It serves municipalities, electric cooperatives, other investor-owned utilities, registered marketers, and federal and state electric agencies, as well as chemical, educational service, paper product, food product, lumber and wood product, health service, textile manufacturing, rubber and miscellaneous plastic product, and fabricated metal product industries. The company was founded in 1924 and is based in Cayce, South Carolina.” SCANA is attractively valued at a blended P/E ratio of 14 and offers a dividend yield of 4.3%. Since the beginning of 2015, SCANA’s stock price has inevitably moved from moderate overvaluation to its current fair valuation level. (click to enlarge) It should be no surprise that when reviewing the performance of SCANA Corp. relative to the S&P 500 that the index outperforms on a total return basis. However, as previously discussed, the attractiveness of utilities comes from their relative safety and superior dividend income-producing ability. Therefore, I direct the reader’s attention to the cumulative total dividend income advantage of SCANA Corp. over the S&P 500. (click to enlarge) Since the primary attraction of investing in utility stocks is for their safety and high dividend income, each candidate’s ability to support their dividend is of paramount importance. The following FUN Graph (fundamental underlying numbers) reflects revenues per share (revps), cash flow per share (cflps) and dividends paid per share (dvpps). Clearly, dividend coverage is supported by revenues and cash flows. (click to enlarge) The Southern Company (NYSE: SO ) Short business description, courtesy S&P Capital IQ: “The Southern Company, together with its subsidiaries, operates as a public electric utility company. It is involved in the generation, transmission, and distribution of electricity through coal, nuclear, oil and gas, and hydro resources in the states of Alabama, Georgia, Florida, and Mississippi. The company also constructs, acquires, owns, and manages generation assets, including renewable energy projects. As of December 31, 2014, it operated 33 hydroelectric generating stations, 33 fossil fuel generating stations, 3 nuclear generating stations, 13 combined cycle/cogeneration stations, 9 solar facilities, 1 biomass facility, and 1 landfill gas facility. The company also provides digital wireless communications services with various communication options, including push to talk, cellular service, text messaging, wireless Internet access, and wireless data; and wholesale fiber optic solutions to telecommunication providers in the Southeast. The Southern Company was founded in 1945 and is headquartered in Atlanta, Georgia.” Southern Company is attractively valued at a blended P/E ratio of 15.1 and offers a dividend yield of 5.1%. Since the beginning of 2015, Southern Company’s stock price has inevitably moved from moderate overvaluation to its current fair valuation level. (click to enlarge) It should be no surprise that when reviewing the performance of Southern Company relative to the S&P 500 that the index outperforms on a total return basis. However, as previously discussed, the attractiveness of utilities comes from their relative safety and superior dividend income-producing ability. Therefore, I direct the reader’s attention to the cumulative total dividend income advantage of Southern Company over the S&P 500. (click to enlarge) Since the primary attraction of investing in utility stocks is for their safety and high dividend income, each candidate’s ability to support their dividend is of paramount importance. The following FUN Graph (fundamental underlying numbers) reflects revenues per share (revps), cash flow per share (cflps) and dividends paid per share (dvpps). Clearly, dividend coverage is supported by revenues and cash flows. (click to enlarge) Xcel Energy Inc. (NYSE: XEL ) Short business description, courtesy S&P Capital IQ: “Xcel Energy Inc., through its subsidiaries, engages primarily in the generation, purchase, transmission, distribution, and sale of electricity in the United States. It operates through Regulated Electric Utility, Regulated Natural Gas Utility, and All Other segments. The company generates electricity using coal, nuclear, natural gas, hydro, solar, biomass, oil and refuse, and wind energy sources. It is also involved in the purchase, transportation, distribution, and sale of natural gas. In addition, the company engages in developing and leasing natural gas pipelines, and storage and compression facilities; and investing in rental housing projects. It serves residential, commercial, and industrial customers, as well as public authorities in the portions of Colorado, Michigan, Minnesota, New Mexico, North Dakota, South Dakota, Texas, and Wisconsin. Xcel Energy Inc. was founded in 1909 and is based in Minneapolis, Minnesota.” Xcel Energy is attractively valued at a blended P/E ratio of 15.9 and offers a dividend yield of 3.9%. Since the beginning of 2015, Xcel Energy’s stock price has inevitably moved from moderate overvaluation to fair valuation territory. With this particular candidate, I would suggest patiently waiting until the P/E ratio was closer to 15 and the dividend above 4%. (click to enlarge) It should be no surprise that when reviewing the performance of Xcel Energy relative to the S&P 500 that the index outperforms on a total return basis. However, as previously discussed, the attractiveness of utilities comes from their relative safety and superior dividend income-producing ability. Therefore, I direct the reader’s attention to the cumulative total dividend income advantage of Xcel Energy over the S&P 500. (click to enlarge) Since the primary attraction of investing in utility stocks is for their safety and high dividend income, each candidate’s ability to support their dividend is of paramount importance. The following FUN Graph (fundamental underlying numbers) reflects revenues per share (revps), cash flow per share (cflps) and dividends paid per share (dvpps). Clearly, dividend coverage is supported by revenues and cash flows. (click to enlarge) Wisconsin Energy Corporation (NYSE: WEC ) Short business description, courtesy S&P Capital IQ: “Wisconsin Energy Corporation, through its subsidiaries, generates and distributes electric energy. The company operates in two segments, Utility Energy and Non-Utility Energy. It generates electricity from coal, natural gas, oil, hydroelectric, wind, and biomass. The company provides electric utility services to customers in the paper, foundry, food products, and machinery production industries, as well as to the retail chains. It also provides retail gas distribution services in the state of Wisconsin, as well as transports customer-owned gas to paper, food products, and fabricated metal products industries; and generates, distributes, and sells steam. As of December 31, 2014, the company serves approximately 1,133,600 electric customers in Wisconsin and the Upper Peninsula of Michigan; and approximately 1,089,000 gas customers in Wisconsin, as well as 440 steam customers in metropolitan Milwaukee, Wisconsin. In addition, it invests in and develops real estate, including business parks and other commercial real estate projects primarily in southeastern Wisconsin. The company was founded in 1981 and is headquartered in Milwaukee, Wisconsin.” Wisconsin Energy is attractively valued at a blended P/E ratio of 17.1 and offers a dividend yield of 3.7%. Since the beginning of 2015, Wisconsin Energy’s stock price has inevitably moved from moderate overvaluation to its current fair valuation level. With this particular candidate, I consider it attractive even though its P/E ratio is a little high and its dividend yield slightly below 4%. However, relative to most utilities, this company’s superior growth potential compensates by providing the potential for above-average total return. (click to enlarge) It should be no surprise that when reviewing the performance of Wisconsin Energy relative to the S&P 500 that the index outperforms on a total return basis, however, in this case the return differential is narrow. Once again, as previously discussed, the attractiveness of utilities comes from their relative safety and superior dividend income-producing ability. Therefore, I direct the reader’s attention to the cumulative total dividend income advantage of Wisconsin Energy over the S&P 500. (click to enlarge) Since the primary attraction of investing in utility stocks is for their safety and high dividend income, each candidate’s ability to support their dividend is of paramount importance. The following FUN Graph (fundamental underlying numbers) reflects revenues per share (revps), cash flow per share (cflps) and dividend paid per share (dvpps). Clearly, dividend coverage is supported by revenues and cash flows. (click to enlarge) Summary and Conclusions When looking to the utility sector, it is both impractical and unrealistic to expect above-average, long-term total returns. Instead, it is more sensible to consider investing in utilities stocks for the advantages and benefits they can offer and provide. These include high current yield, relative safety and the opportunity for consistent but moderate capital appreciation. Consequently, I contend that utility stocks represent viable investment choices under certain rational needs and objectives. These would include but are not limited to the need for high current income, safety and predictable but moderate, inflation-fighting capital appreciation. However, due to the low growth nature of utility stocks, these attributes are only available when current valuations are attractive, as I believe they currently are for the five candidates presented in this article. I cannot emphasize enough the importance of fair valuation when considering utility stocks. Therefore, I suggest that prudent investors might consider investing in fairly valued utility stocks if they need income and if they are concerned about safety and capital preservation. Utility stocks can also serve as a viable alternative for parking cash. This last point is especially relevant when the valuations of other equity options are extended as they are today. Disclosure: Long KMB,ED,SCG at the time of writing. Disclaimer: The opinions in this document are for informational and educational purposes only and should not be construed as a recommendation to buy or sell the stocks mentioned or to solicit transactions or clients. Past performance of the companies discussed may not continue and the companies may not achieve the earnings growth as predicted. The information in this document is believed to be accurate, but under no circumstances should a person act upon the information contained within. We do not recommend that anyone act upon any investment information without first consulting an investment advisor as to the suitability of such investments for his specific situation. Disclosure: The author is long KMB,ED, SCG. (More…) The author wrote this article themselves, and it expresses their own opinions. The author is not receiving compensation for it. The author has no business relationship with any company whose stock is mentioned in this article.