Tag Archives: learn-more

Time To Consider Tortoise Energy Infrastructure Corporation?

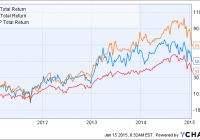
Summary Energy stocks have fallen in the past several months due to volatility in the price of oil. Midstream MLPs involved with the transportation or storage of fuels offer lower, but more stable distributions. This article presents a number of reasons why investors should consider TYG for exposure to the midstream MLP space. Introduction What will the price of oil be in three months time? If you think I know the answer to that question, I have a prime real estate in the Bahamas to sell you. What is known is that energy MLPs have done rather poorly recently. As a readers of my ” Buy-the-Dip High-Yield ” portfolio would know, buying on the dips allows you to lock in higher yields and grasp the potential for capital appreciation. Upstream (also known as E&P) MLPs have fallen the hardest in recent months, with bellwethers such as Line Energy (NASDAQ: LINE ) plunging by about two-thirds. While their yields are the highest, upstream MLPs also carry more risk due to their acute sensitivity to the price of oil. I considered buying upstream-containing MLP funds (see my previous articles on YMLP , MLPJ and MLPY ) to mitigate this risk, but ultimately decided that the entire sector was too volatile at this time. In comparison, midstream MLPs, which are involved with the transportation (via pipeline, rail, barge, oil tanker or truck) and storage of crude or refined petroleum products, tend to offer lower but more stable distributions. Tortoise Energy Infrastructure Corporation Upon consideration of the various midstream MLP ETFs, ETNs and CEFs on the market, I ultimately decided on purchasing Tortoise Energy Infrastructure Corporation (NYSE: TYG ). My reasons for buying TYG can be broken down into three reasons: 1. Long track record of (out)performance As described in my recent article , TYG has over 10 years of track record performance. Among MLP CEFs, only Kayne Anderson MLP Investment Company (NYSE: KYN ) has a similarly long history. Over the last three years, when the benchmark Alerian MLP ETF (NYSEARCA: AMLP ) became available, TYG has returned 17.83% annualized (by NAV), compared to 14.51% for KYN and 8.87% for AMLP. After accounting for its 25.29% leverage, TYG returned 14.23%, which is still higher than AMLP. The following graph shows the total return percentages of TYG, KYN and AMLP over the past few years. Note that the graph shows price return rather than NAV return. TYG Total Return Price data by YCharts As mentioned in the previous article, KYN actually had a better price return compared to TYG over the last few years, whereas TYG had a better NAV return. I believe that NAV return is a better reflection of performance compared to price return, since the value of a CEF is ultimately based on its NAV. Unfortunately YCharts does not have a ability to chart NAV total return. 2. Historically large discount As mentioned many times in my previous articles, mean reversion of premium/discount values is an effective strategy to add an extra bit of performance to your CEF holdings. Basically, the strategy entails buying CEFs when their discount exceeds their historical average, allowing you to profit from mean reversion as the discount narrows. TYG currently trades at a discount of -5.80%. The following chart shows the premium/discount for TYG (graph constructed from data supplied by Tortoise Capital Advisors ). (click to enlarge) We can see that for most of its 10-year history, apart from a brief spurt in 2008 and during the last year, TYG has traded at a persistent premium. The following table shows the average premium/discount values for TYG over various time periods (premium/discount data are from CEFConnect except for the 10-year time period which was manually calculated). Time Premium/discount Current -5.80% 1-year -4.97% 3-year 5.99% 5-year 9.02% 10-year 8.48% Therefore, we can see that TYG has a very large discount relative to its 3-year, 5-year and 10-year averages, indicating that now would be a good time to consider buying this fund for midstream MLP exposure. We also note that TYG had recently fallen to as low as -10% discount in September of last year, which would have been an even better time to buy the fund. 3. Reasonable expense ratio TYG charges a management fee of 1.62%* (according to CEFConnect). This seems high, but once you factor in the benchmark AMLP’s 0.85% expense ratio and the 25.29% leverage of the fund, you are really only paying 0.44% more for the active management of TYG. This compares favorably to KYN, which charges 1.12% for “active expense” (see my previous article for how this was calculated). *Excludes interest expenses and deferred tax liabilities. Given the significant outperformance of TYG vis-a-vis the benchmark over the last few years, I consider the management fee well worth it. 4. Possible downside protection Note: I’m not a tax expert so please take the following with a grain of salt. MLP CEFs (or ETFs) structured as corporations accrue deferred tax liabilities over the years, which will act as a drag on NAV (compared to an ETN) when the underlying constituents are advancing. Conversely, in a falling market an MLP CEF/ETF should fall less than an MLP ETN because the CEF/ETF will be able to accrue a deferred tax asset, or to decrease its deferred tax liability. George Spritzer’s [CFA] excellent article explains the benefit of a deferred tax liability: Another interesting feature of deferred tax liabilities is that they provide some cushion on the downside if there were a major correction in the MLP sector. This would cause a decrease in the deferred tax liabilities, which translates into less of a penalty when the regular unadjusted NAV is computed. Moreover, Mr. Spritzer estimates that the true discount for TYG is even higher (around 36%) once the deferred tax liabilities are accounted for. Indeed, if the CEF managers are using tax minimization strategies to boost the NAV return of the CEF over the benchmark AMLP, which is subject to the same tax drag as the CEFs but is passively managed, then that is even more the reason to pay for active management. To see the deferred tax liability in action, consider the price action of AMLP (an ETF) relative to JP Morgan Alerian MLP (NYSEARCA: AMJ ) (an ETN) over the last five days, a period where oil-related stocks took another punch to the stomach. AMLP and AMJ are both passive benchmarks that track similar indices but the outperformance of AMLP on the downside is probably due to its accrued deferred tax liabilities. TYG did even better, though part of this could have been due to fluctuations in premium/discount values. TYG Price data by YCharts Therefore, my investing in an MLP CEF (or ETF) over ETN that has accrued deferred tax liabilities, you gain some downside protection. Summary This article presents several reasons why investors looking to gain exposure to the midstream MLP space should consider TYG. Due to overall volatility in the energy sector, I would recommend that investors slowly dollar-cost average their way into this fund instead of buying the whole amount in one go.

IDLV Deserves Consideration – The Low Correlation To SPY Is Beautiful

Summary I’m taking a look at IDLV as a candidate for inclusion in my ETF portfolio. The expense ratio is a little high relative to my cheap tastes, but certainly within reason. The correlation to SPY is low and based on reasonable trade volumes. Returns since inception have been fairly weak, but the measuring period is less than 3 years. The ETF might fit for my portfolio. I’m not assessing any tax impacts. Investors should check their own situation for tax exposure. Investors should be seeking to improve their risk adjusted returns. I’m a big fan of using ETFs to achieve the risk adjusted returns relative to the portfolios that a normal investor can generate for themselves after trading costs. I’m working on building a new portfolio and I’m going to be analyzing several of the ETFs that I am considering for my personal portfolio. One of the funds that I’m considering is the PowerShares S&P International Developed Low Volatility Portfolio (NYSEARCA: IDLV ). I’ll be performing a substantial portion of my analysis along the lines of modern portfolio theory, so my goal is to find ways to minimize costs while achieving diversification to reduce my risk level. What does IDLV do? IDLV attempts to track the total return (before fees and expenses) of the S&P BMI International Developed Low Volatility Index. At least 90% of the assets are invested in funds included in this index. IDLV falls under the category of “Foreign Large Blend”. Does IDLV provide diversification benefits to a portfolio? Each investor may hold a different portfolio, but I use (NYSEARCA: SPY ) as the basis for my analysis. I believe SPY, or another large cap U.S. fund with similar properties, represents the reasonable first step for many investors designing an ETF portfolio. Therefore, I start my diversification analysis by seeing how it works with SPY. I start with an ANOVA table: (click to enlarge) The correlation is excellent at 71%. I want to see low correlations on my international investments. Extremely low levels of correlation are wonderful for establishing a more stable portfolio. I consider anything under 50% to be extremely low. However, for equity securities an extremely low correlation is frequently only found when there are substantial issues with trading volumes that may distort the statistics. Standard deviation of daily returns (dividend adjusted, measured since April 2012) The standard deviation is great. For IDLV it is .7265%. For SPY, it is 0.7420% for the same period. SPY usually beats other ETFs in this regard, so a lower volatility level is very impressive. Because the ETF has fairly low correlation for equity investments and a low standard deviation of returns, it should do fairly well under modern portfolio theory. Liquidity looks fine Average trading volume isn’t very high, a bit over 50,000, but that also isn’t low enough to be a major concern for me. Mixing it with SPY I also run comparisons on the standard deviation of daily returns for the portfolio assuming that the portfolio is combined with the S&P 500. For research, I assume daily rebalancing because it dramatically simplifies the math. With a 50/50 weighting in a portfolio holding only SPY and IDLV, the standard deviation of daily returns across the entire portfolio is 0.6794%. With 80% in SPY and 20% in IDLV, the standard deviation of the portfolio would have been .7045%. If an investor wanted to use IDLV as a supplement to their portfolio, the standard deviation across the portfolio with 95% in SPY and 5% in IDLV would have been .7312%. Why I use standard deviation of daily returns I don’t believe historical returns have predictive power for future returns, but I do believe historical values for standard deviations of returns relative to other ETFs have some predictive power on future risks and correlations. Yield & Taxes The distribution yield is 3.17%. That appears to be a respectable yield. This ETF could be worth considering for retiring investors. I like to see strong yields for retiring portfolios because I don’t want to touch the principal. By investing in ETFs I’m removing some of the human emotions, such as panic. Higher yields imply lower growth rates (without reinvestment) over the long term, but that is an acceptable trade off in my opinion. I’m not a CPA or CFP, so I’m not assessing any tax impacts. Expense Ratio The ETF is posting .35% for a gross expense ratio, and .25% for a net expense ratio. I want diversification, I want stability, and I don’t want to pay for them. The expense ratio on this fund is slightly higher than I want to pay for equity securities, but not high enough to make me eliminate it from consideration. I view expense ratios as a very important part of the long term return picture because I want to hold the ETF for a time period measured in decades. Market to NAV The ETF is at a .23% premium to NAV currently. Premiums or discounts to NAV can change very quickly so investors should check prior to putting in an order. The ETF is large enough and liquid enough that I would expect the ETF to stay fairly close to NAV. Generally, I don’t trust deviations from NAV and I will have a strong resistance to paying a premium to NAV to enter into a position. Largest Holdings The diversification is very good in this ETF. My favorite thing about the ETF is easily the diversification. If I’m going to be stuck with that expense ratio, I expect it to buy a fairly strong level of diversification and in this case it appears to do just that. (click to enlarge) Conclusion I’m currently screening a large volume of ETFs for my own portfolio. The portfolio I’m building is through Schwab, so I’m able to trade IDLV with no commissions. I have a strong preference for researching ETFs that are free to trade in my account, so most of my research will be on ETFs that fall under the “ETF OneSource” program. I like the correlation and the diversification in the holdings. Overall, the fund is looking pretty good. While I’m fairly cheap in regards to expense ratios, this one isn’t too bad. A few years ago I would have treated it as being very favorable, but I’m getting spoiled by seeing the ETFs with gross expense ratios under .10. I don’t place a large importance on historical returns (outside of risk), but the fund did underperform SPY by a fairly large amount over the holding period I used. The dividend adjusted close for SPY moved up by 49.11% and for IDLV it moved up 19.9%. I’m going to keep IDLV in my list of potential ETFs for international exposure, but if it makes the final round of challengers I’ll need to dig into the securities and make sure they are capable of producing higher levels of returns. Since it is an international equity fund, I’d be looking at a 5% to 10% allocation if it is selected. The author has no positions in any stocks mentioned, and no plans to initiate any positions within the next 72 hours. The author wrote this article themselves, and it expresses their own opinions. The author is not receiving compensation for it (other than from Seeking Alpha). The author has no business relationship with any company whose stock is mentioned in this article. Additional disclosure: Information in this article represents the opinion of the analyst. All statements are represented as opinions, rather than facts, and should not be construed as advice to buy or sell a security. Ratings of “outperform” and “underperform” reflect the analyst’s estimation of a divergence between the market value for a security and the price that would be appropriate given the potential for risks and returns relative to other securities. The analyst does not know your particular objectives for returns or constraints upon investing. All investors are encouraged to do their own research before making any investment decision. Information is regularly obtained from Yahoo Finance, Google Finance, and SEC Database. If Yahoo, Google, or the SEC database contained faulty or old information it could be incorporated into my analysis. The analyst holds a diversified portfolio including mutual funds or index funds which may include a small long exposure to the stock.

QJPN Borders On Being Too Good To Be True

Summary I’m taking a look at QJPN as a candidate for inclusion in my ETF portfolio. The expense ratio is a bit high, but the diversification is moderate. The correlation with SPY appears low, and the overall risk level for a portfolio looks great. However, weak liquidity could be influence results. Despite the relatively short history on QJPN, I’ll keep it on my short list for international exposure. I’m not assessing any tax impacts. Investors should check their own situation for tax exposure. Investors should be seeking to improve their risk adjusted returns. I’m a big fan of using ETFs to achieve the risk adjusted returns relative to the portfolios that a normal investor can generate for themselves after trading costs. I’m working on building a new portfolio and I’m going to be analyzing several of the ETFs that I am considering for my personal portfolio. One of the funds that I’m considering is the SPDR MSCI Japan Quality Mix ETF (NYSEARCA: QJPN ). I’ll be performing a substantial portion of my analysis along the lines of modern portfolio theory, so my goal is to find ways to minimize costs while achieving diversification to reduce my risk level. What does QJPN do? QJPN attempts to provide results which are comparable (before fees and expenses) to the total return of the MSCI Japan Quality Mix Index. QJPN falls under the category of “Japan Stock”. Does QJPN provide diversification benefits to a portfolio? Each investor may hold a different portfolio, but I use (NYSEARCA: SPY ) as the basis for my analysis. I believe SPY, or another large cap U.S. fund with similar properties, represents the reasonable first step for many investors designing an ETF portfolio. Therefore, I start my diversification analysis by seeing how it works with SPY. I start with an ANOVA table: (click to enlarge) The correlation is about 44%, which is phenomenal for Modern Portfolio Theory. The extremely low correlation makes it much easier to mix the ETF into a portfolio and take advantage of the benefits of diversification. My goal is risk adjusted returns, and my method is minimizing risk. Standard deviation of daily returns (dividend adjusted, measured since June 2014) The standard deviation is very reasonable. For QJPN it is .8159%. For SPY, it is 0.7232% for the same period. SPY usually beats other ETFs in this regard, and the low correlation with SPY makes the higher standard deviation acceptable. Short time frame Investors should be aware that this is a substantially shorter time frame than I usually use. I would like to have about 3 years of data on the ETF for running statistics and half of one year is short enough to introduce sampling errors. In statistics, the minimum sample size is generally 30 so over 130 days of trading returns may seem sufficient, but I would caution investors to take this with a grain of salt. Liquidity concern The average volume comes in at just under 2000 shares. That’s a potential problem for investors that need liquidity and for running correlation values. I checked the dividend adjusted closing values for each day and there were very few times that the change was 0.00%, which means the low volume of trades was not the only factor in the low standard deviation. For statistical validity, I’m more concerned about the relatively short time frame that I have available than the number of shares trading each day. For an investor concerned about spreads and liquidity, the low number of shares trading could be the bigger concern. Mixing it with SPY I also run comparisons on the standard deviation of daily returns for the portfolio assuming that the portfolio is combined with the S&P 500. For research, I assume daily rebalancing because it dramatically simplifies the math. With a 50/50 weighting in a portfolio holding only SPY and QJPN, the standard deviation of daily returns across the entire portfolio is 0.6553%. If an investor wanted to use QJPN as a supplement to their portfolio, the standard deviation across the portfolio with 95% in SPY and 5% in QJPN would have been .7063%. While the low correlation makes very large positions look quite appealing, I wouldn’t want to risk my money on those statistics holding. However, the low correlation and reasonable standard deviation make this a strong contender for a position in my portfolio, even if I have to limit the exposure to something much smaller than the statistics would have suggested. Due to the potential for the low trading volumes and short time frame to distort the statistics, I will want more data before making a final decision on the ETF. So far, I am definitely considering it. Why I use standard deviation of daily returns I don’t believe historical returns have predictive power for future returns, but I do believe historical values for standard deviations of returns relative to other ETFs have some predictive power on future risks and correlations. Yield & Taxes The SEC yield is 1.37%. That is too weak for a retiring investor to live off the yield, but the ETF still could merit a small position as part of a rebalancing plan to reduce the overall risk level in the portfolio is the investor was certain he or she would not have liquidity needs that would force them to sell. I’m not a CPA or CFP, so I’m not assessing any tax impacts. Expense Ratio The ETF is posting .30% for an expense ratio. I want diversification, I want stability, and I don’t want to pay for them. The expense ratio on this fund is slightly higher than I want to pay for an equity fund, but it isn’t enough to disqualify the ETF from consideration. Market to NAV The ETF is at a .29% premium to NAV currently. Premiums or discounts to NAV can change very quickly so investors should check prior to putting in an order. I wouldn’t want to pay a premium greater than .1% when investing in an ETF, unless I could find a solid accounting reason for the premium to exist. This premium looks small enough that I think I could enter into a position with a limit buy order that removed the premium. Largest Holdings The diversification within the ETF is moderate. Normally I want more diversification, but if the correlation and standard deviation hold up over a longer time period, I wouldn’t have any problem with the level of diversification in the ETF. (click to enlarge) Conclusion I’m currently screening a large volume of ETFs for my own portfolio. The portfolio I’m building is through Schwab, so I’m able to trade QJPN with no commissions. I have a strong preference for researching ETFs that are free to trade in my account, so most of my research will be on ETFs that fall under the “ETF OneSource” program. QJPN is going to be on my short list (for now) for potential inclusion in my portfolio as part of my international exposure. If QJPN continues to look better than other international ETFs under modern portfolio theory I will extend my analysis to look for other ETFs with similar holdings and a longer trading history so if the data on those ETFs support the statistics so far on QJPN.