Tag Archives: beautiful

Making The Patient Sicker

By Craig Lazzara Years ago, I saw a cartoon picturing two Victorian-era doctors discussing a patient. “What did you prescribe for Jones’ rheumatism?” asked the first; the second answered “A cold bath and a brisk walk every morning.” “Good God, man, that will give him pneumonia!” said the first. “I know,” replied the second doctor, “I made my reputation curing that.” Somehow I was reminded of this exchange when I learned from this morning’s news that some institutional investors, smarting from recent losses, are considering increasing their commitment to active equity management. Their operating assumption seems to be that active managers will do a better job of capital preservation in a challenging and volatile market. There’s certainly some plausibility to this argument. It turns out, however, to be another beautiful theory mugged by a gang of facts . The facts come from our periodic SPIVA reports, which compare the results of actively-managed mutual funds against passive benchmarks. Weak markets, it turns out, are no panacea for active managers. In 2008, e.g., 54% of large-cap U.S. funds underperformed the S&P 500. Results were even worse for mid- and small-cap managers (75% and 84% underperformers, respectively). Statistics say, in other words, that moving from passive to active as a way of managing market volatility is likely to make performance worse, not better . Fortunately for anxious investors, passive strategies which focus on the lowest volatility segment of the equity market are most likely to outperform precisely when the market is weakest. Consider, for example, the S&P 500 Low Volatility Index and its cousin, the S&P 500 Low Volatility High Dividend Index: Both of these indices are designed to attenuate the returns of the S&P 500 in both directions; historically, they have both tended to underperform market rallies but outperform when markets are weak. Their reliability as defensive vehicles has far exceeded that of active management. Investors concerned about continuing volatility and market weakness should consider indicizing their defensive strategies. Disclosure: © S&P Dow Jones Indices LLC 2015. Indexology® is a trademark of S&P Dow Jones Indices LLC (SPDJI). S&P® is a trademark of Standard & Poor’s Financial Services LLC and Dow Jones® is a trademark of Dow Jones Trademark Holdings LLC, and those marks have been licensed to S&P DJI. This material is reproduced with the prior written consent of S&P DJI. For more information on S&P DJI and to see our full disclaimer, visit www.spdji.com/terms-of-use .

Value And Momentum: A Beautiful Combination

Asset allocation should be a dynamic process. Value-based asset allocation can serve as a long-term investment guide. Momentum can potentially add value by allowing tactical shifts. In our most recent articles, Diversification Is Not Sufficient and Value Based Asset Allocation , we documented two simple strategies for asset allocation. The strategies are based on two seemingly opposed factors, value and momentum. We illustrated in each article the historical results of following each strategy. Empirically, each demonstrated superior results to a static allocation approach. This article illustrates the benefits of combining the two strategies. The value-based asset allocation system (Value Allocator) is a robust enough system on its own to help you navigate the uncertain markets and avoid getting caught in the next crash. The problem is that the system is most likely behaviorally impossible to apply. Using momentum to complement the strategy is an important enhancement that provides participation in further growth and protection in the down markets. The momentum strategy appears to deliver the best results historically. However, we did not examine the impact of transaction costs (most likely negligible) and taxes (significant). We have no way to estimate the tax ramifications of any system as it is obviously only successfully analyzed at the individual level. The momentum-based strategy, because of the short-term gains, is most likely the least tax efficient. Momentum strategies are also difficult to follow year in and year out. Momentum trading does not always resemble the overall stock market. In fact, these types of strategies often look much different from the traditional stock indices like the Dow Jones Industrial or the S&P 500. Since the bottom in 2009, the Barclays CTA Index (a common benchmark for trend following) has been down in every year except for 2010 and 2014. The stock market has not had a negative year since 2008. Again, momentum strategies in isolation are extremely difficult to follow over a long period. In efforts to remain pragmatic, we have combined the value based strategy and a simple momentum strategy to provide a comprehensive asset-allocation system. From this point forward, we will reference the Value Allocator as the strategic component of our asset allocation, and the momentum strategy as our tactical overlay. The combination of the two strategies keeps an investor from moving the entire policy portfolio tactically and keeps a portion in a passive, strategic posture. The strategic component is based on the assumption that markets revert to the average. The problem is that mean reversion occurs over a period of seven to ten years. Valuations tell us very little about what is going to happen over the subsequent one to three years. Our strategic asset allocation process is based on long-term value and contrarian positioning. Tactical asset allocation is the process of taking positions in various investments based on short to intermediate term opportunities. Our tactical overlay is therefore based on reacting to the trend. This is an interesting relationship as the two strategies can offer up diametrically opposed recommendations. For instance, when the US stock market is overvalued, the Value Allocator would recommend rotating to a more conservative portfolio. At the same time, if the trend was positive but the market still overvalued, the tactical overlay would recommend overweighting. You can see the conflicts that can arise, and we assure you they have surfaced in the past. The Value Allocator-as illustrated in Value Based Asset Allocation -can rotate between 30 percent stocks and 70 percent bonds and 70 percent stocks and 30 percent bonds. The tactical portfolio is either 100 percent in stocks or 100 percent in the US 10-year Treasury bonds. The following matrix embodies all possible allocations when the two strategies are combined in equal proportions: Undervalued Market Overvalued Market Positive Trend 85% stocks /15% bonds 65% stocks/35% bonds Negative Trend 35% stocks /65% bonds 15% stocks /85% bonds The investor can have as little as 15 percent in stocks and as much as 85 percent. The wide range allows the investor to adapt to all market conditions, protecting when the odds are poor and growing when the odds favor return enhancement. Instead of fixing the allocation on a static portfolio, investors are allowed the flexibility to adapt their risk tolerance to the current environment. For instance, if the current market environment is undervalued, and the trend is positive, the environment is favorable for stocks. Thus, the investor would be positioned heavily in that asset class. (click to enlarge) The combination of the Value Allocator and momentum strategy outpaced the S&P 500 and fifty-fifty (stocks-bonds) benchmarks by a large degree. The advantage of the combination of these two strategies is quite clear. The worst loss the combination strategy experienced from 1972 to 2014 was 9 percent in 1974 when the market was down almost 26 percent. The Value Allocator, when analyzed in isolation, was down almost 18 percent during that same year. The momentum system added an extra layer of protection when the Value Allocator arrived early to the party. In addition to providing an extra layer of protection, the combination strategy provided growth that would have otherwise been missed during the late 1990s and from 2003 to 2007. The market stayed overvalued from 1990 until the beginning of 2009. If you had followed the Value Allocator during this period, you would have been disappointed. The combination strategy would have minimized the underperformance to the benchmark by keeping you at a higher equity position throughout the 1990s. In the chart depicted below, you can see the market outperform the combination strategy over this period. (click to enlarge) The market outperformance was only temporary, however, as the 50 percent decline from the peak in 2000 was largely avoided. In addition, instead of keeping the allocation conservative from 2003 to 2007, tactical positioning kept investors engaged in the markets. Following the Value Allocator alone from 2003 to 2007 would have had the investors conservatively positioned in 30 percent stocks and 70 percent bonds-largely missing the rebound from the tech wreck. The tactical component of the portfolio would have allowed investors to maintain 65 percent in stocks when the trend was positive, despite the overvalued conditions of the market. Astute investors would most likely diversify their strategic asset allocation with tactical positions. Value and momentum are two of the strongest factors of market returns, and their significance remains rather stable over time. Combining both value and momentum strategies in a disciplined fashion can create desirable investment results. Disclosure: I/we have no positions in any stocks mentioned, and no plans to initiate any positions within the next 72 hours. (More…) I wrote this article myself, and it expresses my own opinions. I am not receiving compensation for it. I have no business relationship with any company whose stock is mentioned in this article. Additional disclosure: HYPOTHETICAL PERFORMANCE RESULTS HAVE MANY INHERENT LIMITATIONS. NO REPRESENTATION IS BEING MADE THAT ANY ACCOUNT WILL OR IS LIKELY TO ACHIEVE PROFITS OR LOSSES SIMILAR TO THOSE SHOWN. IN FACT, THERE ARE FREQUENTLY SHARP DIFFERENCES BETWEEN HYPOTHETICAL PERFORMANCE RESULTS AND THE ACTUAL RESULTS SUBSEQUENTLY ACHIEVED BY ANY PARTICULAR TRADING PROGRAM. PAST RESULTS DO NOT GUARANTEE FUTURE RETURNS. HYPOTHETICAL PERFORMANCE FOR ILLUSTRATION PURPOSES ONLY.

IDLV Deserves Consideration – The Low Correlation To SPY Is Beautiful

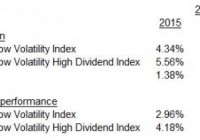
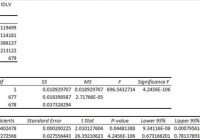
Summary I’m taking a look at IDLV as a candidate for inclusion in my ETF portfolio. The expense ratio is a little high relative to my cheap tastes, but certainly within reason. The correlation to SPY is low and based on reasonable trade volumes. Returns since inception have been fairly weak, but the measuring period is less than 3 years. The ETF might fit for my portfolio. I’m not assessing any tax impacts. Investors should check their own situation for tax exposure. Investors should be seeking to improve their risk adjusted returns. I’m a big fan of using ETFs to achieve the risk adjusted returns relative to the portfolios that a normal investor can generate for themselves after trading costs. I’m working on building a new portfolio and I’m going to be analyzing several of the ETFs that I am considering for my personal portfolio. One of the funds that I’m considering is the PowerShares S&P International Developed Low Volatility Portfolio (NYSEARCA: IDLV ). I’ll be performing a substantial portion of my analysis along the lines of modern portfolio theory, so my goal is to find ways to minimize costs while achieving diversification to reduce my risk level. What does IDLV do? IDLV attempts to track the total return (before fees and expenses) of the S&P BMI International Developed Low Volatility Index. At least 90% of the assets are invested in funds included in this index. IDLV falls under the category of “Foreign Large Blend”. Does IDLV provide diversification benefits to a portfolio? Each investor may hold a different portfolio, but I use (NYSEARCA: SPY ) as the basis for my analysis. I believe SPY, or another large cap U.S. fund with similar properties, represents the reasonable first step for many investors designing an ETF portfolio. Therefore, I start my diversification analysis by seeing how it works with SPY. I start with an ANOVA table: (click to enlarge) The correlation is excellent at 71%. I want to see low correlations on my international investments. Extremely low levels of correlation are wonderful for establishing a more stable portfolio. I consider anything under 50% to be extremely low. However, for equity securities an extremely low correlation is frequently only found when there are substantial issues with trading volumes that may distort the statistics. Standard deviation of daily returns (dividend adjusted, measured since April 2012) The standard deviation is great. For IDLV it is .7265%. For SPY, it is 0.7420% for the same period. SPY usually beats other ETFs in this regard, so a lower volatility level is very impressive. Because the ETF has fairly low correlation for equity investments and a low standard deviation of returns, it should do fairly well under modern portfolio theory. Liquidity looks fine Average trading volume isn’t very high, a bit over 50,000, but that also isn’t low enough to be a major concern for me. Mixing it with SPY I also run comparisons on the standard deviation of daily returns for the portfolio assuming that the portfolio is combined with the S&P 500. For research, I assume daily rebalancing because it dramatically simplifies the math. With a 50/50 weighting in a portfolio holding only SPY and IDLV, the standard deviation of daily returns across the entire portfolio is 0.6794%. With 80% in SPY and 20% in IDLV, the standard deviation of the portfolio would have been .7045%. If an investor wanted to use IDLV as a supplement to their portfolio, the standard deviation across the portfolio with 95% in SPY and 5% in IDLV would have been .7312%. Why I use standard deviation of daily returns I don’t believe historical returns have predictive power for future returns, but I do believe historical values for standard deviations of returns relative to other ETFs have some predictive power on future risks and correlations. Yield & Taxes The distribution yield is 3.17%. That appears to be a respectable yield. This ETF could be worth considering for retiring investors. I like to see strong yields for retiring portfolios because I don’t want to touch the principal. By investing in ETFs I’m removing some of the human emotions, such as panic. Higher yields imply lower growth rates (without reinvestment) over the long term, but that is an acceptable trade off in my opinion. I’m not a CPA or CFP, so I’m not assessing any tax impacts. Expense Ratio The ETF is posting .35% for a gross expense ratio, and .25% for a net expense ratio. I want diversification, I want stability, and I don’t want to pay for them. The expense ratio on this fund is slightly higher than I want to pay for equity securities, but not high enough to make me eliminate it from consideration. I view expense ratios as a very important part of the long term return picture because I want to hold the ETF for a time period measured in decades. Market to NAV The ETF is at a .23% premium to NAV currently. Premiums or discounts to NAV can change very quickly so investors should check prior to putting in an order. The ETF is large enough and liquid enough that I would expect the ETF to stay fairly close to NAV. Generally, I don’t trust deviations from NAV and I will have a strong resistance to paying a premium to NAV to enter into a position. Largest Holdings The diversification is very good in this ETF. My favorite thing about the ETF is easily the diversification. If I’m going to be stuck with that expense ratio, I expect it to buy a fairly strong level of diversification and in this case it appears to do just that. (click to enlarge) Conclusion I’m currently screening a large volume of ETFs for my own portfolio. The portfolio I’m building is through Schwab, so I’m able to trade IDLV with no commissions. I have a strong preference for researching ETFs that are free to trade in my account, so most of my research will be on ETFs that fall under the “ETF OneSource” program. I like the correlation and the diversification in the holdings. Overall, the fund is looking pretty good. While I’m fairly cheap in regards to expense ratios, this one isn’t too bad. A few years ago I would have treated it as being very favorable, but I’m getting spoiled by seeing the ETFs with gross expense ratios under .10. I don’t place a large importance on historical returns (outside of risk), but the fund did underperform SPY by a fairly large amount over the holding period I used. The dividend adjusted close for SPY moved up by 49.11% and for IDLV it moved up 19.9%. I’m going to keep IDLV in my list of potential ETFs for international exposure, but if it makes the final round of challengers I’ll need to dig into the securities and make sure they are capable of producing higher levels of returns. Since it is an international equity fund, I’d be looking at a 5% to 10% allocation if it is selected. The author has no positions in any stocks mentioned, and no plans to initiate any positions within the next 72 hours. The author wrote this article themselves, and it expresses their own opinions. The author is not receiving compensation for it (other than from Seeking Alpha). The author has no business relationship with any company whose stock is mentioned in this article. Additional disclosure: Information in this article represents the opinion of the analyst. All statements are represented as opinions, rather than facts, and should not be construed as advice to buy or sell a security. Ratings of “outperform” and “underperform” reflect the analyst’s estimation of a divergence between the market value for a security and the price that would be appropriate given the potential for risks and returns relative to other securities. The analyst does not know your particular objectives for returns or constraints upon investing. All investors are encouraged to do their own research before making any investment decision. Information is regularly obtained from Yahoo Finance, Google Finance, and SEC Database. If Yahoo, Google, or the SEC database contained faulty or old information it could be incorporated into my analysis. The analyst holds a diversified portfolio including mutual funds or index funds which may include a small long exposure to the stock.