Silver Ready To Run Higher In Major New Upleg
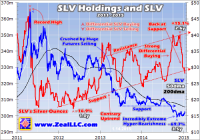
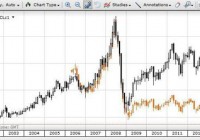
Silver is ultimately driven by gold’s fortunes, so as gold continues mean reverting higher silver is going to catch a massive bid. This buying will initially come from American stock traders and futures speculators, who will aggressively buy SLV shares, cover silver-futures shorts, and add new longs. This major new buying, likely to approach a staggering couple-hundred million ounces in a matter of months, will serve to launch silver higher. Silver looks to be on the verge of a major new upleg, finally emerging from the past couple years’ ugly sentiment wasteland. This beleaguered precious metal recently bottomed as futures speculators threw in the towel on their extreme shorting. And while investors’ ongoing silver stealth buying continues, it’s been modest. So there is vast room for capital inflows to accelerate dramatically as gold mean reverts higher. Silver has always had a special allure for hardened contrarian investors. Its price action is exceptionally volatile, with massive rallies erupting from time to time that multiply capital deployed in it. With silver’s relatively-small market size, it doesn’t take a lot of new investment buying to catapult prices higher. And shifting sentiment, a powerful self-feeding motivator, fuels the big swings in capital flows that really move silver. When investors wax bullish on this white metal, its price soars with a fury few other investments can match. Later when silver falls out of favor again, prices collapse . And that’s the miserable story of the past couple years. Silver dropped 19.7% in 2014 after plunging a brutal 35.6% in 2013. Such dismal performance naturally left silver universally despised, the pariah of the investment world. But that is changing. Silver is ready to run again , a very exciting prospect given the huge uplegs it is renowned for. Silver’s fundamentals are quite unique. Though it is primarily an industrial metal with steady global supply and demand, investment capital can slosh in and out in a big way. The bullish sentiment that’s necessary to trigger big silver demand spikes comes from one thing, gold prices. Gold dominates silver psychology. When gold is weak like during recent years, investors shun silver so its price crumbles and languishes. But when gold strengthens, investors flood back into the white metal. Silver leverages and amplifies gold’s gains, making it one of the best investments when gold is returning to favor. And gold’s long-overdue mean-reversion rebound upleg out of recent years’ crazy anomalous lows is now underway . While ultimately gold drives silver through that sentiment link, the daily capital flows responsible for most of the white metal’s price action largely come through two major conduits. Stock investors add or shed silver exposure by buying or selling shares in the flagship silver ETF, the Shares Silver Trust ETF (NYSEARCA: SLV ). And silver futures are the epicenter of speculation, where traders make big leveraged bets. Both the levels of SLV’s physical-silver-bullion holdings and American speculators’ aggregate long and short contracts in silver futures reveal silver is almost certainly embarking on a major new upleg. Each of these critical capital pipelines into silver shows great room for more investor and speculator buying. And that will come as gold continues recovering on balance, unwinding its extreme anomaly of recent years. Since the pools of stock-market capital are so vast, let’s start with SLV. This ETF’s mission is to track the price of silver so stock investors can gain diversifying exposure in their portfolios. Since the supply and demand for SLV shares almost never exactly matches that of underlying silver, differential buying and selling of ETF shares develops. If not addressed, it would soon force SLV to decouple from silver and fail. In order to keep SLV share prices closely mirroring the silver price, this ETF’s custodians have to quickly equalize any excess share supply and demand into silver bullion itself. When stock investors buy SLV shares faster than silver is being bought, SLV threatens to decouple to the upside. So its custodians issue new shares, adding supply to satisfy this excess demand. The cash raised is used to buy silver bullion . Conversely, when SLV shares are being sold faster than silver, it will soon fail to the downside. The only way to prevent this is to equalize the excess SLV-share supply into silver itself. SLV’s custodians do this by buying back excess SLV shares, with these purchases funded by selling some of the silver bullion held in trust for SLV shareholders. Thus SLV holdings levels are a key barometer of silver demand. And they now reveal low stock-investor exposure to silver prices, which is very bullish since that leaves lots of room for new buying as gold continues recovering. This first chart shows SLV’s physical-silver-bullion holdings in red, with SLV prices superimposed on top in blue. As stock investors see gold and therefore silver starting to move decisively higher, they are likely to buy tens of millions of ounces in short order. Silver’s last mini-mania peaked in April 2011, above $48 per ounce. For most of the time since, silver has been grinding lower on balance. As of early November 2014 in SLV terms, silver had fallen a brutal 69.7% over 3.5 years. That powerful bear market left silver universally loathed, deeply out of favor with investors and speculators. Most assumed that vexing downward spiral would persist indefinitely. But considering how rotten and epically bearish silver sentiment has been, the trend in SLV’s holdings has been rather amazing. Since way back in May 2012, years before silver would finally bottom, the bullion that SLV holds in trust for its shareholders has risen on balance . That means stock investors were buying SLV shares faster than silver was being bought, or selling them slower than it was being sold. This contrary uptrend has witnessed dazzling episodes of strong differential buying, most notably in early 2013, mid-2013, and late 2014. Unfortunately silver prices didn’t respond super-favorably to any of these since American futures speculators were dumping vast amounts of silver contracts at the same times. But if these speculators had merely been neutral on silver, its price would have soared on SLV buying. But after SLV’s holdings hit a relatively-high 350.2m ounces as December 2014 dawned, this ETF was slammed by heavy year-end differential selling pressure. That month alone its holdings fell 5.3%, and were down 6.8% total by last week. That represents massive silver selling pressure of 23.8m ounces. And the reason for this is easy to understand. Silver had really underperformed, and institutions dominate SLV. Pension funds, mutual funds, and hedge funds are the largest SLV shareholders by far. They always want to show winners on their trading books as years end, when many investors make decisions about which funds to allocate capital to. So there is lots of so-called window dressing in December, funds buying high-performing stocks while selling laggards. With SLV down 19.5% last year, it was sure the latter. In addition, in early November silver had just slumped to a deep new 4.7-year low on extreme futures shorting. Bearishness was off-the-charts epic, with virtually everyone convinced silver was doomed to spiral lower indefinitely. So I suspect plenty of fund managers capitulated after that, saying the heck with silver. Their exit certainly contributed to the major differential selling pressure SLV suffered last month. But actually lower SLV holdings are bullish . They imply stock investors are way underexposed to silver, and leave lots of room for capital to migrate back in. With gold recovering, the odds are very high that stock investors will soon return to SLV in a serious way. The resulting differential buying pressure on SLV shares should easily blast this ETF’s holdings back up near their multi-year resistance near 352m ounces. That would require 25.6m ounces of stock-investor silver buying in short order, a big number. To put this in perspective, the venerable Silver Institute reported total global silver investment demand in 2013 of 256.0m ounces. That equates to 21.3m per month. SLV’s holdings are poised to quickly surge by at least 25m, likely in a matter of weeks. This is big marginal investment demand in such a short period of time! And that projection is far too conservative. Note above that SLV’s holdings surged up to or over their uptrend’s resistance when silver prices were quite weak . Imagine how much more intense the stock-investor silver buying through SLV will be if silver is actually surging. I fully expect that this year SLV’s holdings will easily surpass their all-time record high of 366.2m ounces achieved back in April 2011. That would require enough differential buying of SLV shares to force its holdings 39.8m ounces higher, a massive boost in investment demand. And even at that old record, the amount of capital parked in SLV would still be small. Since silver prices were so high that last time silver was really in favor, SLV’s silver bullion held in trust for its shareholders was worth $17.2b. But silver is priced far lower these days. So the same record SLV holdings levels would be worth merely $6.2b today, just over a third as much. And capital measured in single-digit billions is a trivial drop in the bucket for the stock markets. It will only take a tiny fraction of stock investors parking some diversifying capital in SLV to blast its holdings dramatically higher. And all the resulting ETF underlying physical bullion buying will accelerate silver’s upleg. In the investing world, nothing begets demand like higher prices . Investors don’t want to own anything until it is already rallying, and the longer and higher it climbs the more they buy. So uplegs in silver, and anything really, tend to be self-feeding. Buying drives prices higher, which entices in still more buyers, which lifts prices even higher, and the cycle grows. So silver investing via SLV has vast upside potential. But in recent years stock-investor capital alone has proved insufficient to ignite a major silver rally. And that is where silver’s dominant day-to-day price driver comes in, the silver futures trading by American speculators . With investors largely missing in action still after silver’s excessively-weak past couple years, futures speculators’ trading is silver’s primary driver. This critical relationship is crystal-clear in this next chart. It shows American speculators’ total long and short contracts in silver futures on a weekly basis as reported by the CFTC in its famous Commitments of Traders reports. The green line is the total long contracts speculators hold, bullish bets on silver prices. And the red line is their total shorts, the bearish bets. The yellow line shows both series’ deviation from normal years’ averages, while SLV is rendered in blue again. Silver’s extreme 4.7-year lows back in early November were solely the result of extreme selling by those American futures speculators. They effectively capitulated, convincing themselves the universal hyper-bearish outlook for silver was righteous. So they aggressively shed long contracts while spectacularly ramping shorts, subjecting silver to withering selling pressure. It’s impressive silver didn’t crater much lower. Back in July after gold surged on the Fed’s Janet Yellen claiming there was no inflation, speculators’ leveraged long-side bets on silver hit a 3.7-year high of 90.3k contracts. But as bearishness set in again thanks to heavy gold-futures shorting , their longs collapsed by 20.5% or 18.5k contracts by early December. With each contract controlling 5000 ounces of silver, that was a lot of selling for the markets to absorb. We are talking about a staggering 92.6m ounces slamming the markets in less than 5 months! It’s no wonder silver slumped to major new lows under such a massive onslaught. But it gets even worse, as the new shorting by speculators was far more extreme than their long liquidation. Between late July and early November, speculators’ total shorts skyrocketed an astounding 166.2% or 43.7k contracts! Now in the futures markets, the price impact of an existing long contract being sold or a new short one being added is identical . So speculators shorting 43.7k new contracts deluged the markets with a truly mind-boggling 218.5m ounces of silver in just over 3 months! That is the equivalent to over 5/6ths of 2013’s total global investment demand. Silver’s resiliency despite that epic selling was actually amazing. Silver’s secular bull was born back in November 2001 at just $4 an ounce, and our weekly CoT data on futures speculators’ positions extends back farther to January 1999. Speculators’ bearish bets on silver in early November of 70.0k contracts was the highest ever seen since at least then. I suspect it was an all-time record high! Speculators had likely never been more bearish, never more leveraged against silver. But since silver’s swoon was relatively mild compared to that mammoth futures selling, there had to be great latent investor demand out there absorbing that torrent of supply. The fact that investors were quietly buying when everyone was convinced silver was doomed is super-bullish. Their ranks and capital inflows will swell dramatically as gold continues mean reverting back up to far-higher normal levels. And speculator futures buying is going to fuel the early gains before investors fully take the baton in silver’s next mighty upleg. Since silver futures are so highly leveraged, selling them short is an exceedingly-risky bet. Today the CME Group only requires margin of $6500 on deposit for each silver-futures contract speculators hold. But at $17 silver, a 5000-ounce contract is worth $85,000. That’s leverage of 13.1x! Stock speculators have been legally limited to 2-to-1 leverage since 1974, 13 to 1 is crazy. Speculators who run minimum margin will lose 100% of their capital risked if silver merely moves 7.6% against their bet. And silver’s super-volatile history shows it doesn’t take long, a day or two, for such big swings to erupt. This risk is particularly acute for the speculators short silver, since they legally have to buy to cover. Shorting requires speculators to effectively borrow silver before they sell it, with the hope of buying it back later at lower prices to repay their debts. The only way to settle those debts is to close their short contracts by buying offsetting longs . This buying is compulsory as silver rallies and erodes their capital risked, so they quickly buy to cover. And as you can see, the short covering has already been fast and furious. But it’s not over yet! In the latest CoT week, speculators were still short 35.9k contracts. This remained well above their average short levels of 21.5k in the normal years between 2009 to 2012. So merely to mean revert to those norms, not even overshoot in the other direction which is always the case after extremes, they still have to buy to cover another 14.4k contracts. That equates to another 72.1m ounces of buying! Meanwhile the long-side speculators will get more bullish and bold as silver rebounds, partially on short covering. They will ramp up their bets again, inevitably pushing their total contracts back up near long-side uptrend resistance around 93k contracts. That would require 17.5k contracts of buying, or another 87.4m ounces. And don’t forget the 39.8m or so likely coming from stock traders through SLV very soon. Add speculator short covering, long contracts rebounding, and stock-investor SLV buying, and silver is looking at potential near-term buying over the coming few months of a staggering 199.3m ounces! That is the equivalent of nearly 4/5ths of the entire silver investment demand for all of 2013. The potential silver upleg that much buying in a relatively short period of time would fuel is massive. Silver is truly ready to run. And really that’s just the start. Traditional silver investing doesn’t come through silver futures or ETFs, but through physical bars and coins. And once the futures buying and ETF buying pushes silver high enough for long enough to convince investors this new upleg is the real deal, traditional physical demand will soar and take the baton. Futures and ETF buying really just jump starts the even-larger main show. With silver’s prospects out of its recent extreme lows looking so incredibly bullish, all investors need to get silver exposure in their portfolios. Physical silver bars and coins, and even SLV, are fine ways to do it. But their upside is limited to silver’s gains, they can’t leverage it. Meanwhile the best of the silver miners’ and explorers’ stocks will amplify silver’s upleg by multiples, potentially earning fortunes for investors. The bottom line is silver is ready to run higher in a major new upleg. Silver is ultimately driven by gold’s fortunes, so as gold continues mean reverting higher silver is going to catch a massive bid. This buying will initially come from American stock traders and futures speculators. They will aggressively buy SLV shares faster than silver is being bought, cover still-large silver-futures shorts, and add new silver-futures longs. This major buying, likely to approach a couple-hundred million ounces in a matter of months, will serve to launch silver higher. And nothing attracts investors like rallying prices, so global investment demand will ramp dramatically. Investors are so underexposed to silver after leaving it for dead in recent years that they will need enormous buying to attain any reasonable silver exposure. Silver will soar on these inflows. Additional disclosure: I’m long extensive gold-stock and silver-stock positions which have been recommended to our newsletter subscribers.