Tag Archives: investing ideas

MDY’s 2015 2nd-Quarter Performance And Seasonality
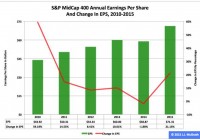
Summary The SPDR S&P MidCap 400 ETF in the first half ranked No. 1 among the three most popular exchange-traded funds based on the S&P Composite 1500’s constituent indexes. In the second quarter, the ETF’s adjusted closing daily share price dipped by -1.12 percent. And in June, the fund’s share price dropped by -1.28 percent. The SPDR S&P MidCap 400 ETF (NYSEARCA: MDY ) during 2015’s first half was first by return among the three most popular ETFs based on the S&P Composite 1500’s constituent indexes: It expanded to $273.24 from $262.52, an increase of $10.72, or 4.08 percent. Over the same period, MDY behaved better than the iShares Core S&P Small-Cap ETF (NYSEARCA: IJR ) by 6 basis points and the SPDR S&P 500 ETF (NYSEARCA: SPY ) by 2.91 percentage points. In contrast, MDY last quarter performed worse than SPY and IJR by -1.34 and -1.29 percentage points, in that order. Most recently, MDY last month lagged IJR by -2.34 percentage points and led SPY by 73 basis points. Comparisons of changes by percentages in SPY, MDY, IJR, the small-capitalization iShares Russell 2000 ETF (NYSEARCA: IWM ) and the large-cap PowerShares QQQ (NASDAQ: QQQ ) during the first half, over Q2 and in June can be found in charts published in “SPY’s 2015 2nd-Quarter Performance And Seasonality.” Figure 1: S&P 400 EPS , 2010-2014 Actual And 2015 Projected (click to enlarge) Notes: (1) Estimates are employed for the 2015 data. (2) The EPS scale is on the left, and the change-in-EPS scale is on the right. Source: This J.J.’s Risky Business chart is based on analyses of data in the S&P 500 Earnings and Estimate Report released June 30. MDY may have behaved OK in the first half, but the ETF might have a hard time performing OK in the second half. As Howard Silverblatt, senior index analyst at S&P Dow Jones Indices, indicated in the S&P 500 Earnings and Estimate Report series this year, the analysts’ average earnings-per-share estimate for the S&P 400 index underlying MDY for 2015 slipped to $71.31 June 30 from $75.06 March 26 (Figure 1). And I believe this EPS estimate continues to be highly unrealistic, as it would require growth of 21.13 percent over last year. As a result, I think there will be more downward revisions in this estimate, which collectively will not constitute an MDY tailwind. Figure 2: MDY Monthly Change, 2015 Vs. 1996-2014 Mean (click to enlarge) Source: This J.J.’s Risky Business chart is based on analyses of adjusted closing monthly share prices at Yahoo Finance . MDY behaved worse in the first half of this year than it did during the comparable periods in its initial 19 full years of existence based on the monthly means calculated by employing data associated with that historical time frame (Figure 2). The same data set shows the average year’s strongest quarter was the fourth, with an absolutely large positive return, and its weakest quarter was the third, with an absolutely small negative return. Figure 3: MDY Monthly Change, 2015 Vs. 1996-2014 Median (click to enlarge) Source: This J.J.’s Risky Business chart is based on analyses of adjusted closing monthly share prices at Yahoo Finance. MDY also performed worse in the first half of this year than it did during the comparable periods in its initial 19 full years of existence based on the monthly medians calculated by using data associated with that historical time frame (Figure 3). The same data set shows the average year’s strongest quarter was the fourth, with an absolutely large positive return, and its weakest quarter was the third, with an absolutely small negative return. Disclaimer: The opinions expressed herein by the author do not constitute an investment recommendation, and they are unsuitable for employment in the making of investment decisions. The opinions expressed herein address only certain aspects of potential investment in any securities and cannot substitute for comprehensive investment analysis. The opinions expressed herein are based on an incomplete set of information, illustrative in nature, and limited in scope. In addition, the opinions expressed herein reflect the author’s best judgment as of the date of publication, and they are subject to change without notice. Disclosure: I/we have no positions in any stocks mentioned, and no plans to initiate any positions within the next 72 hours. (More…) I wrote this article myself, and it expresses my own opinions. I am not receiving compensation for it (other than from Seeking Alpha). I have no business relationship with any company whose stock is mentioned in this article.
ALLETE, Inc: Diversified Utility Seeking New Growth Areas

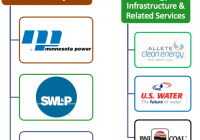
Summary The company just acquired another new wind facility. The company acquired U.S. water earlier in the year which will drive sales growth. 88% of revenue comes from its regulated utility side. It doesn’t get much more boring than ALLETE, Inc (NYSE: ALE ). The diversified utility based in Minnesota is pretty predictable considering 88% of its revenue is from its regulated utilities. It has been seeking new growth areas as of late. It has taken several steps to aid growth that look quite promising. This new diversification, a solid regulated business, and attractive dividend make ALLETE a great long-term pick in the utilities sector. Stepping back and looking at the company as a whole it is easy to see that it is a very diversified utility. Although it generates 88% of its revenue through its regulated business it also has several other segments. Below is the breakdown of the company’s holdings. (Source: ALLETE ) The regulated business has helped the company achieve steady growth over the past couple of years. This is illustrated by the fact that between 2010 and 2014 earnings grew at a compounded annual rate of 6.7%. All the while the company has been diversifying its portfolio. Through the small reoccurring growth in its regulated business and the higher growth possibilities in its other segments the company is forecasting annual EPS growth of 5% for the next couple of years. Along with this it also expresses that it will keep its dividend competitive and growing. Currently the shares sport a 4.3% yield making it very attractive to dividend investors. Specifically there are two areas which should take the company’s growth to the next level. Below I outline what the company is doing in terms of growing its portfolio and diversifying its business. U.S. Water The best example of the company further diversifying its portfolio is when earlier this year it aquired U.S Water. U.S Water is a integrated water management company that provides solutions to many industrial and commercial clients. The company serves clients nationwide and serves many Fortune 500 companies. (Source: ALLETE ) It has increased its customer base from 2,141 in 2011 to over 3,600 in 2014. It also has an excellent track record of retaining these customers with over 90% of customer being retained. In 2014 U.S Water did $120M in sales which the company forecasts will increase between 10-15% annually over the next few years. Considering ALLETE only has revenue of $1.16B in 2014 this is a very significant addition to the business. On top of that growing it at 15% would mean the company expects it to be pulling in nearly $160M by the end of 2016. U.S. Water continues to retain clients and add reoccurring revenue which compliments the regulated part of ALLETE’s business well. ALLETE Clean Energy Renewable energy has become even more popular in recent years as well as more economical. ALLETE has been expanding its clean energy business as it attempts to make its business more diversified and less reliant on fossil fuels. Over the past year it has increasingly built up its presence in this area, particularly in wind generation. This past November the company agreed to actually develop a wind farm for Montana-Dakota Utilities, which is a division of MDU Resources Group (NYSE: MDU ). In the agreement it will end up selling the wind farm to MDU for $200M. While I couldn’t locate the exact amount of capital the company will need to put into the development it did make it clear in the quarter one confrence call that it will have an effect on earnings. It should be noted that the effect of these earnings have not been factored into the earnings guidance the company has given thus far. Other than developing wind farms it has also been acquiring them for its own portfolio. Below are the wind farm aquistions the company has completed over the past couple of months. In December closed a deal to acquire 108 MW facility in Iowa. In January closed a deal to acquire 3 wind farms in 3 different states from AES Corp. (NYSE: AES ). In April closed a deal to acquire 98 MW facility from EDF Renewable. In June closed another deal with AES to acquire 101 MW facility in Pennsylvania. With the latest acquisition the company now has over 500 MW of wind generation in operation. Seeing as it has acquired majority of these this year it should be interesting to see the company grow this business in the next couple of years. In the conference call the company touched upon that it will also see positive effects for the year from these clean energy acquisitions. However, it expects its gains in this area to only offset the losses from the steel industry dynamics that face its Minnesota Power business. Conclusion ALLETE is further diversifying its portfolio to seek new areas of growth. Although it has yet to see positive effects from the newest acquisitions it should start to see them as the year progresses. With these new growth opportunities as well as an extremely strong regulated business to lean on it expects to deliver 5% earnings growth over the next couple of years. This should translate into further dividend growth adding attractiveness to the already high yield of 4.3%. I think as a long-term play ALLETE is making the right moves making itself more diversified and seeking new growth areas. Disclosure: I am/we are long AES. (More…) I wrote this article myself, and it expresses my own opinions. I am not receiving compensation for it (other than from Seeking Alpha). I have no business relationship with any company whose stock is mentioned in this article. Additional disclosure: Always do your own research before investing.

SPY’s 2015 2nd-Quarter Performance And Seasonality

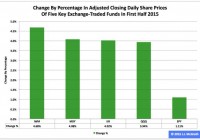
Summary The SPDR S&P 500 ETF in the first half ranked No. 3 among the three most popular exchange-traded funds based on the S&P Composite 1500’s constituent indexes. In the second quarter, the ETF’s adjusted closing daily share price advanced by a rather small 0.22 percent. In June, the fund’s share price declined by a rather large -2.01 percent. The SPDR S&P 500 ETF (NYSEARCA: SPY ) during 2015’s first half was third by return among the three most popular ETFs based on the S&P Composite 1500’s constituent indexes, which encompass the SPDR S&P MidCap 400 ETF (NYSEARCA: MDY ) and the iShares Core S&P Small-Cap ETF (NYSEARCA: IJR ). SPY edged higher to $205.89 from $203.64, an increase of $2.25, or 1.11 percent, but it behaved worse than MDY by -2.98 percentage points and IJR by -2.91 percentage points. Figure 1: Change In Share Prices Of Five Key ETFs In First Half (click to enlarge) Source: This J.J.’s Risky Business chart is based on analyses of adjusted closing daily share prices at Yahoo Finance . Market day in and market day out, I analyze in multiple ways 13 ETFs through my Risky Business Daily Market Seismometer : These funds are SPY, MDY and IJR, as well as the nine Select Sector SPDRs and the small-capitalization iShares Russell 2000 ETF (NYSEARCA: IWM ). I also assess the large-cap (and technology-dominated) PowerShares QQQ (NASDAQ: QQQ ), albeit on a comparatively infrequent basis. Thanks to this monitoring, I anticipate being shocked by market events on occasion, but I do not expect being surprised by them. Anyway, SPY in the first half of the year was the worst performer among the five key ETFs I employ to evaluate equity classes by market cap (Figure 1). Figure 2: Change In Share Prices Of Five Key ETFs In Second Quarter (click to enlarge) Source: This J.J.’s Risky Business chart is based on analyses of adjusted closing daily share prices at Yahoo Finance. SPY was neither the best behaved nor the worst behaved of my five key ETFs last quarter, as these distinctions were claimed by QQQ in the former case and MDY in the latter case (Figure 2). I believe SPY’s lackluster performance, not only in Q2 but also in 2015, is associated with the bias divergence in monetary policy at big central banks around the world whose effects I have discussed ad nauseam at Seeking Alpha, most recently in “NYSE Margin Debt Remains Near All-Time High In May: Risk Rank At No. 53.” Figure 3: Changes In Share Prices Of Five Key ETFs In June (click to enlarge) Source: This J.J.’s Risky Business chart is based on analyses of adjusted closing daily share prices at Yahoo Finance. Greece’s failure to make its payment to the International Monetary Fund Tuesday was preceded by a protracted period of silly shilly-shallying uncommon even by the standards of the eurozone, which is really saying something. The headline risk clearly had an impact on the U.S. stock market, with the beatdown victimizing larger caps more than smaller caps (Figure 3). This disparity in outcomes makes sense because the S&P 500 index firms that provided the data required to paint a complete picture of their global sales in 2012 indicated they booked 53.4 percent of their sales inside the U.S. and 46.6 percent of their sales outside the U.S., as discussed elsewhere . The comparable numbers for S&P 600 index firms the same year were 61.0 percent and 39.0 percent, in that order. As a result, SPY is more exposed to conditions around the world than is IJR. Figure 4: SPY Monthly Change, 2015 Vs. 1994-2014 Mean (click to enlarge) Source: This J.J.’s Risky Business chart is based on analyses of adjusted closing monthly share prices at Yahoo Finance . SPY behaved a lot worse in the first half of 2015 than it did during the comparable periods in its initial 21 full years of existence based on the monthly means calculated by employing data associated with that historical time frame (Figure 4). The same data set shows the average year’s strongest quarter was the fourth, with an absolutely large positive return, and its weakest quarter was the third, with an absolutely small positive return. Figure 5: SPY Monthly Change, 2015 Vs. 1994-2014 Median (click to enlarge) Source: This J.J.’s Risky Business chart is based on analyses of adjusted closing monthly share prices at Yahoo Finance. SPY also performed a lot worse in the first half of 2015 than it did during the comparable periods in its initial 21 full years of existence based on the monthly medians calculated by using data associated with that historical time frame (Figure 5). The same data set shows the average year’s strongest quarter was the fourth, with an absolutely large positive return, and its weakest quarter was the third, with an absolutely small positive return. Disclaimer: The opinions expressed herein by the author do not constitute an investment recommendation, and they are unsuitable for employment in the making of investment decisions. The opinions expressed herein address only certain aspects of potential investment in any securities and cannot substitute for comprehensive investment analysis. The opinions expressed herein are based on an incomplete set of information, illustrative in nature, and limited in scope. In addition, the opinions expressed herein reflect the author’s best judgment as of the date of publication, and they are subject to change without notice. Disclosure: I/we have no positions in any stocks mentioned, and no plans to initiate any positions within the next 72 hours. (More…) I wrote this article myself, and it expresses my own opinions. I am not receiving compensation for it (other than from Seeking Alpha). I have no business relationship with any company whose stock is mentioned in this article.