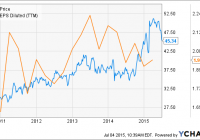
Summary The share price of electric and natural gas utility holding company UIL Holdings reached an all-time high earlier this year following a proposed merger with international utility Iberdrola. The merger would have been good for UIL Holdings, as the company lacks clear earnings growth potential in the face of slow customer expansion and cheap petroleum prices. The company’s shares are not undervalued in the event that the merger fails, while a revised merger price is likely to be lower than the original one. Potential investors looking for utilities investments will find more attractive options elsewhere in the sector at this time. Electric and natural gas utility holding company UIL Holdings (NYSE: UIL ) saw its share price tumble last week after regulators in Connecticut issued a draft decision rejecting its proposed merger with the U.S. subsidiary of European utility Iberdrola (OTCPK: IBDSF ). While the final regulatory decision isn’t due for another two weeks, the market is no longer optimistic that the merger will result in a transaction price above $50 for UIL Holdings’ shares, assuming it happens at all. Despite the recent decline, however, the company’s share price valuations remain well above their pre-2015 ranges despite the presence of a multi-year declining trend to earnings (see figure). This article evaluates UIL Holdings as a potential investment in light of these recent events. UIL data by YCharts UIL Holdings at a glance UIL Holdings is a Connecticut-based diversified regulated energy delivery utility that operates in its home state and west Massachusetts. The holding company, which was formed in 2000 and sold its non-utility segments in 2006, has a total of 727,000 natural gas and electric utility customers. These customers are served via the company’s four utility subsidiaries: United Illuminating Co. [UI], Connecticut Natural Gas [CNG], Southern Connecticut Gas [SCG], and Berkshire Gas [BG]. UI distributes electricity to 325,000 customers in Connecticut and has recently invested heavily in expanding and reinforcing its service area via the construction of new transmission lines. The subsidiary sold its electricity generation assets in 2000 and is focused entirely on delivery and related services. CNG distributes natural gas to 165,000 customers in Connecticut and is expanding into the development and implementation of distributed generation technology. Distributed generation, which allows larger customers to use natural gas as a backup to on-site intermittent sources of electricity such as wind and solar power, is becoming increasingly popular on the eastern seaboard. SCG is also a natural gas distribution utility that was purchased in 2010 from Iberdrola and now has 185,000 customers around the Long Island Sound shoreline. Both SCG and CNG own LNG storage facilities in addition to their natural gas network. Finally, BG distributes natural gas to 36,000 customers in the western half of Massachusetts. UIL Holdings saw its share price and earnings both peak in early 2013 and the former proceeded to underperform the broader sector for the next two years (see figure). Unlike many of its peers, the company was caught relatively flat-footed by the shale gas revolution despite its proximity to the Marcellus Shale, from which it currently sources 73% of the natural gas that it distributes. Its LNG storage facilities were quickly rendered less useful as an expected inflow of seaborne LNG was replaced by abundant domestic natural gas. Furthermore, Connecticut, which is home to the large majority of the company’s consolidated customer base, did not see its economy recover from the effects of the Great Recession as quickly as the U.S. average in 2013 and 2014, causing its earnings growth trend to reverse. Its dividend has in turn remained unchanged in nominal terms since Q1 2009, meaning that it has declined by 10% in real terms over the same period relative to inflation. UIL Holding’s primary means of customer growth in recent years has been by convincing existing homes to convert from heating oil to natural gas. While this effort allowed it to add 16,266 customers last year, the sharp fall in the price of petroleum that occurred in that same year means that the company now expects to add only 12,000 new customers this year. It remains reliant on natural gas, the operations of which generated 67% of its consolidated revenue and more than half of its consolidated net income in FY 2014. UIL data by YCharts Recognizing that earnings growth would only resume via an expanded service area, UIL Holdings began in 2014 to explore mergers and acquisitions. In March of that year it agreed to purchase the operations of Philadelphia Gas Works , the country’s largest municipally-owned natural gas utility, for $1.9 billion. While the deal would have provided the municipality with much-needed cash and expanded the company’s consolidated customer based to 1.2 million across three states, the deal fell apart in December following opposition from labor and the Philadelphia city council, both of which believed that the sale price was insufficient. The market clearly thought otherwise, however, as UIL Holdings’ share price resumed its upward trend and set a new all-time high shortly thereafter. This upward trend was provided with a further boost after Iberdrola announced in February 2015 that it had agreed to acquire UIL Holdings for roughly $3 billion, or an average share price of $52.83. The latter’s share price promptly moved above $50 on the news. The merger was presented as a boon to both companies, allowing Iberdrola to expand its U.S. presence and providing UIL Holdings with 2.4 million new customers in two states and access to 6.3 GW of renewable generation capacity, primarily in the form of wind farms. The two sides were unable to convince Connecticut regulators of the deal’s merits, however, and they rejected the proposed merger last week on the dual grounds that UIL Holdings had not provided it with sufficient evidence that its existing customers would benefit under the deal, or that sufficient corporate safeguards would be implemented. While a final decision is not expected until the middle of July, the regulators also rejected a request by UIL Holdings to give it an additional two months to revise its merger application, stating that this would not be a sufficiently-long period of time in which to do so. The regulators instead encouraged the two companies to start their application over again if they want to move forward with the merger. While a subsequent statement by UIL Holdings’ CEO was ambiguous regarding the path forward, it should be noted that the merger would not have been completed until the end of 2015 had regulatory approval been attained, so this roadblock will delay a potential acquisition by another year in the event that the application is restarted. Furthermore, Iberdrola’s revised purchase price will likely be lower than before in the event that it presses on to reflect the higher regulatory costs that a successful acquisition will entail. Q1 earnings report UIL Holdings reported its Q1 earnings in late April and missed on both lines despite the presence of favorable weather conditions during the quarter. Revenue came in at $584.1 million, missing the consensus estimate by $39.8 million despite increasing YoY by 2.3% (see table). The presence of low energy prices and slightly reduced normalized customer demand was slightly offset by customer growth due to conversions from heating oil to natural gas and harsh winter conditions compared to both the previous Q1 and the long-term average. Gross income rose to $292.7 million from $282.2 million the previous year as customer growth and weather-related demand offset a higher cost of revenue. Operating income fell YoY, however, from $104.4 million to $100.1 million. As with other utilities, UIL Holdings incorporated updated mortality tables reflecting longer life expectancies into its pension costs, which rose as a result. UIL Holdings Financials (non-adjusted) Q1 2015 Q4 2014 Q3 2014 Q2 2014 Q1 2014 Revenue ($MM) 584.1 433.0 293.0 334.8 571.2 Gross income ($MM) 292.7 257.0 198.4 206.5 282.2 Net income ($MM) 57.6 32.3 12.5 9.3 55.5 Diluted EPS ($) 1.01 0.56 0.22 0.16 0.97 EBITDA ($MM) 151.3 123.4 76.1 73.0 146.2 Source: Morningstar (2015). Net income rose slightly YoY from $55.5 million to $57.6 million, resulting in a non-adjusted EPS of $1.01 versus $0.97. EBITDA also rose slightly compared to the previous year from $146.2 million to $151.3 million. The company incurred non-recurring expenses of $6.2 million during the quarter relating to its Philadelphia Gas Works acquisition attempt, its proposed merger with Iberdrola, and regulatory reserve requirements. Adjusted EPS rose slightly from $1.09 to $1.12 but missed the consensus by $0.07, marking at least its f ourth consecutive underwhelming result. UIL Holding’s natural gas subsidiaries performed well, with their consolidated net income rising by 6% compared to the previous year due to customer conversions and cold temperatures. Consolidated net income from the electric distribution and electric subsidiaries fell by 19% and 24% YoY, respectively, although they were mostly flat on an adjusted basis. Strong overall demand caused the natural gas distribution subsidiaries to generate 67% of the company’s consolidated operating income, up from 63% the previous year. UIL Holdings’ ended the quarter with $80.1 million in cash, down from $137.4 million due in part to its non-recurring M&A-related expenses. Its current ratio remained relatively steady at 1.5, however. Long-term debt fell very slightly to $1.7 billion but was more than offset by an increase to short-term debt. $282 million of the company’s total debt load will mature by the end of FY 2018. While any renewal of this debt can be expected to carry higher interest rates due to expected rate hikes later this year, the company’s balance sheet is in a decent position due to its BBB S&P credit rating and availability of another $400 million under its existing credit facilities. UIL Holdings Balance Sheet (restated) Q1 2015 Q4 2014 Q3 2014 Q2 2014 Q1 2014 Total cash ($MM) 80.1 115.6 102.8 175.6 137.4 Total assets ($MM) 5,128.3 5,111.9 4,857.7 5,098.0 5,130.2 Current liabilities ($MM) 444.7 495.6 357.9 604.2 615.5 Total liabilities ($MM) 3,724.8 3,743.7 3,498.7 3,726.8 3,745.1 Source: Morningstar (2015). Outlook The possible collapse of the merger with Iberdrola weakens UIL Holdings’ outlook by reducing the prospect of future earnings growth. The company’s annual adjusted EPS guidance for FY 2015 of $2.30-$2.50, affirmed during the Q1 earnings call , is unlikely to be negative affected since the merger wasn’t expected to close until the end of the year. If achieved, even the low end of this range would represent a decade high, reversing its recent annual EPS trend. Non-adjusted EPS for the year could actually improve if the merger does not proceed by eliminating additional M&A-related expenses. Earnings growth beyond FY 2015 will become much more difficult to achieve in the absence of the merger, however, especially if petroleum prices continue to remain low, dampening heating oil conversion efforts. The company does have the advantage of achieving strong ROEs, especially when compared to the ROEs allowed by regulators. The aforementioned regulatory reserve was set up in response to concerns that its achieved transmission ROE will exceed the allowed ROE in FY 2015, for example. This advantage is mitigated somewhat by its lack of expansion plans in the absence of the merger, however, since this will limit the company’s ability to convert its high ROEs into earnings growth. Furthermore, natural gas distribution ROEs are not as favorable, with SCG and CNG both being allowed ROEs that are only in the single-digits (many of its peers are allowed distribution ROEs above 10%). This has limited the company’s overall ROE to 8.1% (see figure), well below the industry average of 10%. UIL Return on Equity (NYSE: TTM ) data by YCharts Valuation Analyst estimates for UIL Holdings’ diluted EPS in FY 2015 and FY 2016 have remained flat over the last 90 days, although I would not be surprised to see the latter consensus decline if the proposed merger fails in the wake of the regulators’ draft decision. The FY 2015 consensus has fallen very slightly from $2.41 to $2.40 while the FY 2016 consensus has increased very slightly from $$2.57 to $2.58. Based on the company’s share price at the time of writing of $45.34, it has a trailing P/E ratio of 19.6x and forward ratios for FY 2015 and FY 2016 of 18.9x and 17.6x, respectively. While all three ratios have declined in recent months, they are still above even the tops of their respective 5-year ranges (see figure). Investors should also note that the merger price was ultimately to be approximately 17.5x the company’s expected FY 2016 EPS. The company’s share price is currently trading at a level that is slightly above this valuation despite the recent price decline. While the merger can still move ahead, I believe that a revised offer would ultimately be lower than the previous one to account for higher-than-expected regulatory costs. Taken together, these indicators suggest that the company’s shares are overvalued at this time. UIL PE Ratio ( TTM ) data by YCharts Conclusion UIL Holdings has seen its share price decline substantially from an all-time high in the lead-up to and wake of a draft decision by Connecticut regulators to prevent the company’s proposed merger with Iberdrola. Despite this decline, however, I do not believe that the company’s shares are an attractive investment at this time. The merger would have provided it with the ability to generate future earnings growth resulting from an expanded customer base, access to renewable electricity, and its high achieved transmission ROEs. A strong purchase price was in turn the result of these expected earnings. The regulators’ decision casts this growth potential into doubt, however, and the purchase price will likely be lower even in the event that the two companies resubmit a new merger application. Furthermore, UIL Holdings does not provide the history of either earnings growth or dividend growth that makes some utilities attractive even in the absence of a clear value investment thesis. I recommend that those potential investors looking to gain exposure to natural gas and electric utilities search elsewhere, as the presence of bearish sentiment in the sector has created a number of interesting opportunities. UIL Holdings is not one of those at this time. Disclosure: I/we have no positions in any stocks mentioned, and no plans to initiate any positions within the next 72 hours. (More…) I wrote this article myself, and it expresses my own opinions. I am not receiving compensation for it (other than from Seeking Alpha). I have no business relationship with any company whose stock is mentioned in this article.