Tag Archives: function

VNQ: A REIT ETF Worthy Of My Portfolio

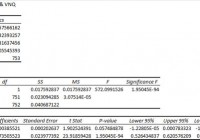
Summary VNQ offers investors the full package of benefits I’m looking for. The ETF is offering excellent correlation benefits to SPY, low expense ratios, and great liquidity. REIT ETF’s generally offer very strong dividend yields. I’m not seeing any reason not to use VNQ. Investors should be seeking to improve their risk adjusted returns. I’m a big fan of using ETFs to achieve the risk adjusted returns relative to the portfolios that a normal investor can generate for themselves after trading costs. I’m working on building a new portfolio and I’m going to be analyzing several of the ETFs that I am considering for my personal portfolio. One of the funds that I’m considering is the Vanguard REIT Index Fund ETF (NYSEARCA: VNQ ). I’ll be performing a substantial portion of my analysis along the lines of modern portfolio theory, so my goal is to find ways to minimize costs while achieving diversification to reduce my risk level. What does VNQ do? VNQ attempts to track the total return (before fees and expenses) of the MSCI U.S. REIT Index. Substantially all of the assets are invested in funds included in this index. VNQ falls under the category of “Real Estate”. Does VNQ provide diversification benefits to a portfolio? Each investor may hold a different portfolio, but I use the SPDR S&P 500 Trust ETF (NYSEARCA: SPY ) as the basis for my analysis. I believe SPY, or another large cap U.S. fund with similar properties, represents the reasonable first step for many investors designing an ETF portfolio. Therefore, I start my diversification analysis by seeing how it works with SPY. I start with an ANOVA table: (click to enlarge) The correlation is just under 66%. That’s a very solid level of correlation and not unusual for comparing a REIT index to SPY. As an investor using modern portfolio theory, I’m happy with seeing that level of correlation. Of course, the value low correlation wouldn’t mean much if the values were being distorted by poor liquidity. The average volume of nearly 5 million shares per day suggests that liquidity shouldn’t be a concern. That’s a good sign for investors wanting verification of the statistics or wanting to know that they can exit the position with less concern about it deviating from NAV. Standard deviation of daily returns (dividend adjusted, measured since November 2013) The standard deviation is fairly reasonable. For VNQ it is .843%. For SPY, it is 0.736% for the same period. The ETF is definitely showing more volatility than SPY by a noticeable margin when we compare returns on a daily basis. Given the low correlation, it should still improve the risk profile of the portfolio. Mixing it with SPY I run comparisons on the standard deviation of daily returns for the portfolio assuming that the portfolio is combined with the S&P 500. For research, I assume daily rebalancing because it dramatically simplifies the math. With a 50/50 weighting in a portfolio holding only SPY and VNQ, the standard deviation of daily returns across the entire portfolio is 0.719%. With 80% in SPY and 20% in VNQ, the standard deviation of the portfolio would have been .711%. If an investor wanted to use VNQ as a supplement to their portfolio, the standard deviation across the portfolio with 95% in SPY and 5% in VNQ would have been .727%. In each scenario, the overall portfolio has less volatility than SPY. I am leaning towards running REITs in my portfolio as 10 to 20% of the total portfolio. Why I use standard deviation of daily returns I don’t believe historical returns have predictive power for future returns, but I do believe historical values for standard deviations of returns relative to other ETFs have some predictive power on future risks and correlations. Yield & Taxes The distribution yield is 3.60%. I like to see strong yields for retiring portfolios because I don’t want to touch the principal. By investing in ETFs I’m removing some of the human emotions, such as panic. Higher yields imply lower growth rates (without reinvestment) over the long term, but that is an acceptable trade off in my opinion. The ETF is composed of REITs, so investors concerned about the taxation impacts of investing in a REIT ETF should seek tax advice from a qualified professional. Expense Ratio The ETF is posting an expense ratio of .10%. I want diversification, I want stability, and I don’t want to pay for them. An expense ratio of .10% is absolutely beautiful and extremely attractive for an ETF that is also offering low correlation to SPY, strong yields, and great liquidity. Market to NAV The ETF is at a .05% discount to NAV currently. Premiums or discounts to NAV can change very quickly so investors should check prior to putting in an order. Generally speaking, that discount to NAV isn’t big enough to be a big deal. However, even a small discount to NAV is fairly attractive when we are talking about a high quality ETF. In my opinion, this is easily one of the most attractive ETFs I have examined. Largest Holdings The diversification in the holdings isn’t going to be a strong selling point. Nothing against Simon Property Group (NYSE: SPG ), but over 8% in the position is pretty big. Given that the expense ratio is .10%, I think that offsets the relatively mediocre level of diversification within the positions. The other individual companies that are making up the top several sections all have different exposures, such as self-storage, multi-family housing, and health care. (click to enlarge) Conclusion The combination of correlation, liquidity, and yield makes a great investment for investors that want to reduce the overall volatility of their portfolio without having their capital tied up in investments that can be difficult to exit. For investors looking at the very long term picture, the extremely low expense ratio is beautiful. Vanguard and Schwab have provided some ETFs with very low expense ratios. I don’t think an ETF should be chosen purely for the expense ratio, but I do believe investors should be very aware of it. When I’m putting together hypothetical portfolio positions, one of the things I include is the expense ratio of the ETFs to track the overall expense ratio on the portfolio. In trying to find anything wrong with the ETF, the biggest weaknesses would probably be the size of the position in SPG and the fact that it is market weighted. However, most ETFs are market weighted. Most ETFs also have enough weaknesses that I can easily spot at least something wrong. In the case of VNQ, the market cap issue is offset by the fund having a turnover ratio of only 11%. I’ve had a preference for Schwab funds because I have an account that can trade them for free. However, I also have some significant tax exempt accounts with other brokerages. I’m strongly considering VNQ for a position in my IRA. Got a different opinion? An argument for why I shouldn’t invest in VNQ? Let’s hear it in the comments. Additional disclosure: Information in this article represents the opinion of the analyst. All statements are represented as opinions, rather than facts, and should not be construed as advice to buy or sell a security. Ratings of “outperform” and “underperform” reflect the analyst’s estimation of a divergence between the market value for a security and the price that would be appropriate given the potential for risks and returns relative to other securities. The analyst does not know your particular objectives for returns or constraints upon investing. All investors are encouraged to do their own research before making any investment decision. Information is regularly obtained from Yahoo Finance, Google Finance, and SEC Database. If Yahoo, Google, or the SEC database contained faulty or old information it could be incorporated into my analysis. The analyst holds a diversified portfolio including mutual funds or index funds which may include a small long exposure to the stock.

Managing Volatility, Earnings And Why Agriculture?

The portfolio will always have cash on had to deploy into depressed sectors. Currently we are watching agriculture & Gold mining shares. Agriculture has fantastic fundamentals. I can only see future growth in this sector. Earnings on one of our underlyings (Proctor & Gamble) has been disappointing. Nevertheless we will continue to hold as the company is going through a period of transition. So we have started a portfolio which is producing regular income ( I will post January Income results at the end of the month) but what do we do when we want to add savings to our portfolio on a monthly or yearly basis? To explain this point further, let me illustrate an example. Imagine that at a given point in time in our portfolio (asset class A & asset class B) have done the following over 5 years. Both asset classes started out at zero and we invested $10,000 per year into each asset class. Study both tables below and choose the asset class that you think would have given the best return. Asset Class A Year 1 Unchanged – $100 per share Year 2 Value Drops to $60 per share Year 3 Remains unchanged at $60 per share Year 4 Shoots up to $140 per share Year 5 $100 per share – Where it started Asset Class B Year 1 Unchanged Year 2 Value Increases to $110 per share Year 3 Increases to $120 per share Year 4 Increases to $130 per share Year 5 Finished at $140 per share It may come to surprise you that “Asset Class A” (higher volatility) would have yielded better results and more income. Asset Class B would have risen to $59,150 but “Asset Class A” would have risen to $60,048! – a profit of $10,048. Moreover “Asset Class A” finishes where it started – at $100 per share! How can we use this information for our 1% portfolio? Two things are obvious in my mind. 1. We will never have all our capital invested 2. When individual asset classes become depressed, we will aggressively invest more into that sector. We currently have $460k invested out of a possible million and the depressed sectors that are on my radar are agriculture and Gold mining stocks. We already have capital deployed in these sectors but we will deploy more if we see more weakness. Yesterday we invested in (NYSEARCA: MOO ) and (NYSEARCA: DBA ). Why agriculture and why now? The fundamentals for this asset class are excellent. Let’s go through them. 1. We are losing farmland at an astonishing rate. Moreover, when you combine this with an ever increasing population, this sector screams under-supply. The graphic below shows where we are in terms of arable land on a per person basis 2. The biofuel industry has also put pressure on the agricultural industry. I expect corn, sugar and our ETFs to rise when the price of oil rises as governments continue to invest in renewable energies such as corn and sugar cane-based ethanol. 3. 3rd fundamental is China. With a population of well over a billion and with millions of Chinese joining the middle class, grains supply are taking a hit. Wheat supplies are already falling as middle class Chinese turn to meat. In order to produce meat on mass, cattle must be fed grains. There is a direct link between a growing middle class and higher grain consumption. If China’s middle class continues to grow, grains supply will fall even more 4. Agricultural products could really spike in price if China doesn’t sort out their water problem. China feeds 20% of the world’s population so obviously water is fundamental in maintaining this part of their economy. The problem is far from solved despite the huge sums of money that has been invested by the government. Any disruption here would be ultra bullish for our agriculture ETFs. There are so many reasons to be long agriculture. We will leave our allocation as it is at the moment and then invest more aggressively when we see the trend changing. Earnings are coming in thick and fast in the US but for the most part, they have been disappointing. Big companies such as Microsoft (NASDAQ: MSFT ), Caterpillar (NYSE: CAT ) and (NYSE: UPS ) missed earnings estimates by a big margin. Moreover Procter & Gamble (NYSE: PG ) announced a reduction in earnings of 34% ! Since we have Procter & Gamble in our portfolio, I want to talk a bit about it here. First of all, profits are going to be effected in the short term because of the strong dollar. Its PE ratio is now 22, price to sales ratio is 2.92 and projected sales growth for 2015 is 2.9%. Analysts believe this company is expensive as its stock rose 14% in value in 2014 in the midst of bad earnings. However we are income investors and Procter & Gamble has raised its dividend for 58 years straight! Many investors forget that yields in bellwether stocks go up when the stock price falls. It raised its dividend relentlessly in 2008 and I have no doubt this measure will continue. The company continues to grow even though profits are down in the short term. Also the company needs time to restructure. In 2014 alone Procter & Gamble cut costs aggressively by deciding to stop marketing underperforming brands so it could concentrate on their top performing brands. This was a smart move in my opinion. Usually in business, 80% of your sales come from 20% of your products (80-20 rule). Therefore the company has decided to focus exclusively on its profitable products and ditch the lethargic ones. Firstly it exited the pet food industry last April by selling its pet food brands for almost $3 billion. Then last November, it sold its Duracell brand to Berkshire Hathaway (NYSE: BRK.A ) (NYSE: BRK.B ). Then last month the company sold its Camay and Zest brands to Unilever (NYSE: UL ). A strong dollar is going to make Procter & Gamble even more competitive which will benefit the company and shareholders in the long run. We will continue to hold in our 1% portfolio because the company has always adapted to changing times as the long term chart shows.

Southern Company: Taking A Pass On This Quality Utility Name

Buffett’s words should be heeded concerning Southern Company: “Price is what you pay. Value is what you get”. Compared to 5-yr average fundamentals, Southern Company looks expensive. While not a seller, I would not be a buyer either. However, investors should evaluate their dividend reinvestment position. Many readers know I have been bullish on Southern Company (NYSE: SO ) for some time. Over the previous two years, I have written eight articles focused on SO. With the recent spike in price to the $53 range, SO is now overvalued. At its current price, while I would not be a seller, I would not be a buyer either. “Price is what you pay. Value is what you get,” says Warren Buffett. While SO is a strong utility with a bright future, the value investors are buying is not as attractive as a few months ago. Below is a comparison of current valuations vs SO 5-yr average. The corresponding price is the valuation of SO at each of these 5-yr averages. As shown, these fundamentals indicate SO is overvalued compared to its averages since 2009. Source: Morningstar, MyInvestmentNavigator.com Earnings have been reduced recently due to write-offs of cost overruns at their Kemper project. There are questions being raised as to first $900 million cost overruns on the Vogtle power plants as the resolution has now been passed to the courts. The consensus belief is SO will win these lawsuits based on the terms of their contract. However, delays from the planned fourth-quarter 2017 and fourth-quarter 2018 start dates seem inevitable, and could lead to future charges against earnings. Southern Company still has several very positive trends that should continue to reward shareholders. The regulatory environment is quite favorable in its service territory. Return on invested capital ROIC is one of the best in the business at a 5-yr average of 6.75%, even after a dismal 2013 at barely over 5%. Unlike many of its peers, SO’s ROIC is above its weighted average cost of capital WACC of 4.2%. Southern Company has earned an A- rating by S&P Capital IQ for 10-year consistency in earnings and dividend growth. The rating puts SO in the top 3.3% of all companies reviewed by S&P and in the top five management teams for the entire utility sector. These are very admirable qualities for long-term investors. Concerning distributed generation, CEO Fanning is on record as embracing this potentially disruptive power trend. In an interview last year, he is quoted, Fanning touts efforts by Southern subsidiary Georgia Power to promote both utility-scale solar as well as distributed generation. “If somebody wants to buy distributed generation, I want to sell it to ’em. I’m completely happy to do that.” To support that effort, rate structures will have to be redesigned, something Fanning thinks state regulators will be “constructive” about supporting. “You need to do it fairly. There are three components of that. One is revenue , which should be done at avoided cost. Second — it is not net metering; that is a flawed concept. Second is a fair charge for connection to the network, and third is a fair charge for the backup generation and the energy when the wind is not blowing and the sun does not shine. As long as you do that right, we’re 100 percent in,” Fanning said. “This is something where we’ve got to play offense.” Morningstar rates SO with only 2 Stars, not a very compelling value. Their unique Bulls and Bears comments from the latest update in early Dec are: Bulls Say: Southern operates in the business-friendly Southeast, where its traditionally low power prices and sterling reputation help to foster a constructive and stable regulatory atmosphere. As of mid-November, Southern’s dividend yield was 4.5%, well above its peers’ [Author’s note: with the recent run-up in prices, yield is 4.0%]. With a stronger business model and premium returns, the yield premium is appealing in an otherwise overvalued sector. Business investment continues to head to the Southeast, which bodes well for the region’s economy and Southern’s customer base even though residential demand has remained tepid. Bears Say: Southern burns a lot of coal, so complying with carbon emissions and coal ash regulations could require significant investments that would raise customer bills, discourage usage. We include $500 million of potential cost overruns at Vogtle that we project Southern will not be able to recoup in rates and $200 million in extra owners’ costs. These figures could go much higher in a worst-case scenario. Utilities suffer in times of inflation and rising interest rates. Inflation erodes the value of the rate base on which a utility’s allowed returns are calculated. This is where an automatic dividend reinvestment program becomes a bit dicey. Although I wrote a book on DRIPs in 2001 for McGraw Hill, All About DRIPs and DSPs , reinvesting dividends in SO at the current price seems a bit risky. Accumulating the dividend in a cash account for reinvestment in other income stocks may be preferred until SO’s fundamentals improve. While Southern Company is replacing its coal generating capacity with low-cost nuclear, has one of the best management teams in generating Net ROIC, is in a growing service territory with friendly regulators, and is embracing distributed solar generation, the current share valuation leaves much to be desired. Waiting for a better valuation would be prudent. Author’s Note: Please review disclosure in Author’s profile.