Tag Archives: alerts

Own The Strongest Dividend Growers With This ETF

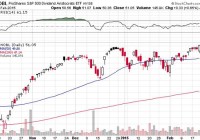
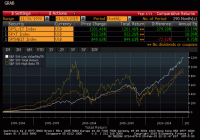
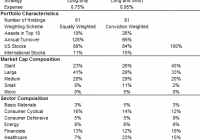
Summary Dividend aristocrats, or blue-chip companies that consistently raise their dividends, tend to outperform the broader market over long periods. Dividend increases are positive predictors of future corporate performance. Dividend aristocrats are unique due to the fact that most companies are unable to increase dividends when facing business cycle downturns and capital market shocks. By offering consistently increasing payouts on a long-term basis, dividend aristocrats act as a hedge against economic uncertainty and provide downside portfolio protection. Dividend aristocrats, or blue-chip companies that consistently raise their dividends , tend to outperform the broader market over long periods. To be considered a dividend aristocrat, a company must typically have raised its dividend for at least 25 consecutive years. Dividend aristocrats are unique due to the fact that most companies are simply unable to continually boost dividend payouts when facing business cycle downturns and capital market shocks. Dividend increases are positive predictors of future corporate performance. By offering consistently increasing payouts on a long-term basis, dividend aristocrats act as a hedge against economic uncertainty and provide downside portfolio protection. The ProShares S&P 500 Dividend Aristocrats ETF (NYSEARCA: NOBL ) tracks the S&P 500 Dividend Aristocrats Index, which only includes companies that (1) are members of the S&P 500 and (2) have increased their dividends for at least 25 consecutive years . If an existing member cuts, or even freezes its dividend, it is dropped from the index. Rebalancing takes place quarterly with an annual reconstitution, taking place during the January rebalance. Only the very best dividend payers are permitted to remain in this elite club. (click to enlarge) What should excite you about NOBL is the fact that the vast majority of companies that comprise this ETF have raised their dividends during some tough times, including the financial crisis of 2008. I don’t know about you, but I find this kind of financial strength and predictability intoxicating, in fact, almost irresistible. The 53 companies in this ETF are equally weighted and they’re diversified across a variety of sectors, such as consumer staples, consumer discretionary, industrials, materials, and many others. Unlike many dividend-oriented ETFs, NOBL does not have the majority of its exposure in financial, telecom or utility stocks, which makes it especially attractive, considering how poorly these stocks perform in a rising interest rate environment. Sector weights are capped at 30% each. NOBL’s current dividend yield is 1.60% and its annual expense ratio is just 35 basis points. An abundance of historical data going back to 2005, when Standard & Poor’s first constructed the S&P 500 Dividend Aristocrats Index, confirms its superior performance over the S&P 500. Over the past 12 months, the S&P 500 Dividend Aristocrats ETF has produced a total return of 17.82% vs. 14.92% for the SPDR S&P 500 Trust ETF (NYSEARCA: SPY ): (click to enlarge) Conclusion The S&P 500 Dividend Aristocrats Index is made up of some of the highest-quality, income-producing stocks available to investors today. Even if you are a risk-averse investor, you may still find NOBL to be an attractive core holding since it’s comprised of companies with stable earnings which produce less volatile returns. NOBL held up better than the S&P 500 during the last bear market. The Aristocrats Index lost -22% during the 2008 financial crisis while the S&P 500 Index fell -37%. NOBL, since late January, is outperforming many “defensive” funds, most of which typically hold utility companies. The Dow Jones Utility Average (DJUA) peaked on January 29th at 652. Now at 600, the DJUA has lost -8% while NOBL has gained +3%. Another potential benefit, because of NOBL’s very small exposure to the Utility sector, would likely be outperformance over most other dividend-paying funds in a rising interest rate environment . You may not be aware of the fact that the 10-year Treasury bond has risen from 1.67% to 2.11% since February 2nd. This move may be a prelude of what’s to come this year. So, bottom line, it may be time to “overweight” NOBL in your investment portfolio. Consider replacing the plain vanilla S&P 500 fund and potentially other “defensive” equity funds in your portfolio with NOBL to enjoy the consistent dividend-paying and defensive attributes of this elite ETF. Additional disclosure: George Kiraly Jr., CFP, MBA is the president of LodeStar Advisory Group, LLC, an independent Registered Investment Adviser located in Short Hills, New Jersey. George Kiraly, LodeStar Advisory Group, and/or its clients may hold positions in the ETFs, mutual funds and/or any investment asset mentioned above. The opinions offered herein are not personalized recommendations to buy, sell or hold securities. Disclosure: The author is long NOBL. (More…) The author wrote this article themselves, and it expresses their own opinions. The author is not receiving compensation for it. The author has no business relationship with any company whose stock is mentioned in this article.

Low Volatility Stocks And Maximum Drawdowns

Low volatility equity strategies have been shown to have historically produced higher risk-adjusted returns, a violation of models that expect higher risk to be compensated with higher returns. Low volatility strategies have produced higher returns because they have outperformed in falling markets. This article details the lower maximum drawdowns of a low volatility strategy, showing the worst returns for the strategy over various time intervals versus the broader market. I have written a number of articles about the Low Volatility Anomaly , and how lower beta stocks have produced higher absolute and risk-adjusted returns than high beta stocks over time. The returns of the S&P Low Volatility Index, the S&P 500, and the S&P 500 High Beta Index since 1990 are compared below: (click to enlarge) Source: Bloomberg, Standard and Poor’s A tilt towards lower volatility stocks was one of my five strategies for outperformance for buy-and-hold investors . Low volatility strategies outperform because they suffer lower drawdowns in tough market environments, but capture most of the upside in bull markets , which is demonstrable in the graph above. In comments on a recent article, a reader queried about what the maximum drawdowns have been for low volatility equity strategies. Using data from the S&P Low Volatility Index (replicated by SPLV ), which measures the performance of the one-hundred least volatile components of the S&P 500, I have captured maximum drawdowns over various time horizons and compared these drawdowns to those of the S&P 500 Index (NYSEARCA: SPY ). (click to enlarge) Unsurprisingly, the worst drawdowns for the Low Volatility strategy and the broader equity market overlapped during the financial crisis. On average, the drawdown for the Low Volatility Index was only two-thirds to three-quarters of the broader market. Over ten year periods, the Low Volatility strategy have always produced positive returns, but this is an admittedly short dataset (1990-current), covering just three business cycle troughs. Disclaimer: My articles may contain statements and projections that are forward-looking in nature, and therefore inherently subject to numerous risks, uncertainties and assumptions. While my articles focus on generating long-term risk-adjusted returns, investment decisions necessarily involve the risk of loss of principal. Individual investor circumstances vary significantly, and information gleaned from my articles should be applied to your own unique investment situation, objectives, risk tolerance, and investment horizon. Disclosure: The author is long SPLV, SPY. (More…) The author wrote this article themselves, and it expresses their own opinions. The author is not receiving compensation for it (other than from Seeking Alpha). The author has no business relationship with any company whose stock is mentioned in this article.

GURU And ALFA: Are Hedge Fund ETFs Worth Your While?

Summary There has been a great deal of interest in ‘hedge fund cloning’ ETFs of late. Despite exhibiting decent performance, a closer look reveals a different story. We remain skeptical of their alpha potential, after a detailed analysis of their track record. There has been significant interest in recent years in “cloning” the equity investment ideas of hedge funds, leading to the launch of several ETFs and indices that track their stock picks. In this article we provide an assessment of the two longest running ETFs, the Global X Guru Index ETF (NYSEARCA: GURU ) and the AlphaClone Alternative Alpha ETF (NYSEARCA: ALFA ). GURU and ALFA At a Glance Despite both being “copy-cat” funds, GURU and ALFA are actually two quite different propositions. Key Features From an investment strategy perspective, the GURU is designed to be 100% long, while the ALFA has the flexibility to go short by 50% subject to market technicals. In other words, one is a long-only equity fund, while the other aims to mimic long/short equity hedge funds by altering its market exposure over time. Due to its hedging ability, the ALFA appears to charge more for this feature, with the expense ratio close to 1%. Portfolio Characteristics A key difference between the two ETFs is their stock weighting methodology. GURU weights its positions equally, and has fewer positions in total. The ALFA applies variable weighting, with higher weights assigned to higher conviction names based on a proprietary scoring methodology. It is more concentrated than GURU in the top holdings, but has a long tail of smaller positions. It is difficult to say which method is more effective, only time will tell. Both portfolios comprise mainly of U.S. stocks, which is intuitive as hedge funds do not disclose their overseas holdings in 13F filings – unless they are U.S.-listed securities, such as ADRs. In terms of portfolio churn, both ETF portfolios have fairly high turnover ratios. For GURU, this is at a staggering 128%. We believe a high turnover is only justified if it results in superior performance, otherwise it typically cranks up excessive trading costs and impacts long-term returns. Portfolio Composition According to Morningstar classifications, both ETFs have a pronounced mid/small-cap bias, as evidenced by their high allocation to SMID cap stocks. The ALFA has a more aggressive tilt than the GURU. From a sector perspective, we would note the high allocation to the tech sector of both funds, although it is not too far from market index weights, as defined by the Russell 1000 Index. Performance Benchmark As both ETFs are essentially U.S. equity funds and exhibit a mid-cap orientation, we believe the Russell 1000 Index (“R1000”) is an appropriate performance yardstick. The Vanguard Russell 1000 ETF (NASDAQ: VONE ) tracks this benchmark and charges a 0.12% fee. Quantitative Analysis – Last 31 Months (1 Jul 2012 – 31 Jan 2015) Below is a summary table of key MPT statistics for the past 31 months, based on monthly data. Investment Results Both the GURU and ALFA have done well over the past 31 months (since common inception date), posting modest outperformance versus the Russell 1000 Index. Risk Both ETFs have exhibited higher volatility than the R1000 (as measured by the standard deviation). At ~11%, this is some 30% higher than the market index. From a beta perspective (sensitivity to equity market movements), both are also higher, at 1.20 and 1.08 respectively. Alpha Alpha is a measure of manager skill on a risk-adjusted basis, in other words it reconciles return and volatility to provide an indication of stocking picking skill. After accounting for volatility, the GURU’s alpha is negative, and the ALFA’s is mildly positive. GURU’s outperformance over the R1000 appears to have been achieved with higher risk. At 1.2 beta, it is akin to R1000 running on steroids, but less efficient. To illustrate this point, if we levered the R1000 to a similar level (beta of 1.2x), this would have yielded better returns at lower volatility. Tracking Error GURU and ALFA are both high tracking error products, meaning their performance pattern can diverge significantly from the R1000 from time to time (both positive and negative) — and benchmark-aware investors should be prepared to stomach this performance divergence. Risk Adjusted Returns Both ETFs have posted identical and good risk-adjusted returns in terms of Sharpe Ratio. However, the slightly levered R1000 once again leaves both ETFs in the dust. Taking It All Together Despite outperforming the R1000 Index in the past 31 months, the alpha of these ETFs are not significant (and negative for GURU), after taking into account their volatility. A Longer Term Perspective For better understanding of the performance pattern of these ETFs, we can look at the indices that they track, which has been back-tested over longer periods. However, one must note that these are “back-tests” and must be treated with a degree of caution. After all, a back-tested index must demonstrate favorable results before a ETF provider is willing to wrap it into an investment product. We do not know how conservative the index producers have been with their assumptions, so we will look no further back than the past 60 months (or five years). 60 Month Statistics (1 Feb 2010 – 31 Jan 2015) The longer term stats paint a similar picture. Guru Index Alpha is again negative over the past five years. Its higher return is explained by higher beta. A similar version (1.1x) of the R1000 would have achieved higher returns at lower levels of volatility. AlphaClone Index Alpha is high at 4.6. This number is a result of a) lower volatility than the R1000 and b) similar level of return. Its 60-month beta is 0.66, a third of the market index. This implies that its market hedge mechanism must have kicked in during this 60 month period, which has provided some protection in down months of the R1000. Despite the existence of alpha, we would note the following: In the period since the ALFA ETF has been live, hedging has not been used, as indicated by its beta of 1.1 to the R1000. It would be interesting to see how it works in practice in the future. In absolute return terms, the back-tested performance of ALFA over the past 60 months is still inferior to the R1000 (15.2 vs. 15.8). A skillful equity long/short hedge fund manager would typically be able to capture less downside, but a similar level of upside, resulting in better returns than the market index over time. This indicates that AlphaClone’s market hedge (think of it as the manager’s skill in shorting the market) have not helped drive extra returns over this 60 month period. A Closer Look at Alpha Patterns We believe outperformance from stock selection comes in waves, and is not constant. There will be extended periods when a portfolio performs well, and extended periods less well due to the existence of style biases (i.e. growth, value, size effect etc). These biases can be in, or out of favor with the market from time to time. To assess alpha patterns we look at the rolling 2-year excess returns versus the R1000. Our assessment period is the last 60 months, as above. Interestingly, the Guru Index has been losing altitude of late, with its margin of outperformance vs. the R1000 dropping fast. This points to a deterioration in its stock selection — possibly due to style biases, a decline in the performance of hedge funds they track, the efficacy of their cloning process, or a combination. Meanwhile, the AlphaClone Index has lagged the R1000 for years (on a rolling 2 year basis), before taking a positive turn in late 2013. This is most likely because the index has very much been long-only and not market hedged since then. Tracking Quality One final factor to consider is the quality of index replication. The good news is that both ETFs appeared to have tracked their underlying indices well after fees in real life. The tracking error is marginally higher for the GURU in the past two calendar years, despite having a lower fee than the ALFA. Our Verdict Over the past 31 months, the GURU and ALFA ETFs have performed well in absolute terms, although if one takes a closer look, reveals a different story. For GURU, we are concerned of its high beta, high portfolio turnover, and stock selection efficacy which has been decreasing recently. For ALFA, we are not big fans of its higher fees and market hedge, which has not been tested in real life. As long-term equity investors interested in maximum capital appreciation, we do not believe that market timing adds value. This is confirmed by the ALFA’s subpar returns to the R1000 over the period under review. Based on our analysis, we remain skeptical of both ETFs’ alpha potential. Disclosure: The author has no positions in any stocks mentioned, and no plans to initiate any positions within the next 72 hours. (More…) The author wrote this article themselves, and it expresses their own opinions. The author is not receiving compensation for it (other than from Seeking Alpha). The author has no business relationship with any company whose stock is mentioned in this article. Additional disclosure: For research purposes, Real Return Partners LLP compile the RR Partners AlphaEquity® Index (Bloomberg: RRALPHA). This is a long-only equity index that tracks the performance of a portfolio of 20 US-listed, 13F equity positions representing the best ideas of an elite group of institutional money managers. The Index is independently calculated and is published as a net total return index. There are no investment products linked to this index.