Tag Archives: etf-hub

VTI: Who Cares About The Middle Class?

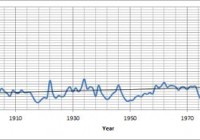
Summary New legislation that may curtail unpaid overtime has been introduced. The P/E ratio of the market is at moderately high levels but the E (earnings) relative to GDP is extremely high. A shift to higher income for labor would be a negative short term catalyst but may be necessary for long term economic health. I’m preparing for the shift by buying less broad/total market funds and more equity REITs. While the turmoil in Greece has been capturing the headlines, there are other issues that may hit much closer to home. I’ve been a fan of indexing the market and riding out the bumps through dollar cost averaging. I believe American investors can be served well by using a diversified index like the Vanguard Total Stock Market ETF (NYSEARCA: VTI ). Even as an analyst, I combine VTI with equity REIT ETFs as the major source of value in my portfolio. I believe in using the index as the main holding and attempting to build around it rather than attempting to individually pick every stock. While VTI is delivering an excellent expense ratio (.05) and excellent diversification (3827 holdings), it is still subject to market risk. I am concerned that we may be nearing a market top for the broad equity market and I am shifting my portfolio to a heavier concentration of equity REITs. Because I believe shorting the market is the game of fools, I would never recommend it. However, I do think the risk/return proposition favors equity REITs. The Middle Class There is a common refrain about the disappearing middle class. I must admit that I do believe over the next decade we may see a further increase in the gap between the “Haves” and the “Have Nots”. In my opinion, the market is far less attractive without consumers to buy the crap on the shelves. Background It helps to remember that the market can still be viewed by running numbers on the S&P 500 which makes up a very substantial portion of VTI. The following chart, built with data from multpl.com, shows the P/E ratios for the S&P 500 over a very long time frame. (click to enlarge) You might notice that we are currently right around the trend, but that is a very serious problem when we consider that earnings are exceptionally high as seen in the chart below: (click to enlarge) Corporate profits after taxes are hitting staggering values by historical measures. I believe a major factor in the high corporate profits is the introduction of more automation and a lack of intense competition in some sectors. One sign for weaker competition is buybacks. When companies are spending their cash on repurchasing shares there is an improvement in the P/E ratio and there is a fundamental increase in the shareholders ownership of the assets, but there is no increase in productivity capacity. A lack of new capacity leads to weaker competition which protects profit margins. If you need to see what high capacity and intense competition looks like, simply research companies in the mining sector. Earnings, ore prices, and share prices have fallen dramatically due to the intense competition. If corporate profits after tax were to revert to a more historically normal level as a percentage of GDP without enormous growth in GDP, it would lead to much lower earnings. Those lower earnings in turn would lead to lower share prices unless the P/E multiples increased significantly. The Headwind for Earnings The White House recently released a fact sheet on some proposed new legislation that would significantly expand the number of workers eligible for overtime pay. Nearly five million workers would be covered and this could set up quite a bit of political sparring. If nothing else changed and the companies simply paid the overtime that is currently avoided through “salaried” compensation, the simple result would be increases in labor expenses and compressed profit margins. At the same time, I would expect increased levels of sales as more money would go to middle class and lower class workers with a high propensity to consume . In short, the money would go into their pockets and then into the cash register at another establishment. Companies Won’t Agree I expect to see some fairly substantial lobbying efforts spend to fight or minimize this bill because the cost of purchasing congressmen and senators is cheaper than the cost of paying overtime to low-wage salaried employees. Was that too blunt? I’d rather get the point across clearly. The legislation is designed to raise the level of salary required to keep an employee exempt. The reason it is important for the long term health of the economy is that the current level is at less than $24,000 per year. By labeling employees as exempt, companies are able to work the employees for overtime that can drive their effective wage rate below minimum wage laws while claiming that the employees are “managers”. To the extent that this encourages companies to simply hire more employees for regular schedules, the change could be positive by improving employment rates and revitalizing a struggling middle class. However, it wouldn’t happen without pain. While the sales would be expected to increase, the weaker margins would compress earnings and I would expect share prices to fall. For VTI, that could mean share prices dropping as low as $90 in a bearish scenario (about a 15% pull back). Long Term I believe the long term implications would be very positive as it would improve employment prospects for many struggling families so a significant pull back would become a great buying opportunity. Without growth in the middle class, I think the growth in EPS from repurchasing shares may become unsustainable because earnings still depend on sales and sales still require consumers that can afford the products. In the short term, growth by repurchasing sales is fine. Over the long term, it fails to provide new productive (physical) assets that generate the wealth that we consume as humans. Seeing an end to unpaid overtime through the guise of “salaried” work would be a short term negative catalyst for stock prices, but it may be necessary for a healthy economy. I’m preparing by shifting more of my purchases into the REIT sector where I expect strong income to translate into higher average rents. I’m reducing my purchases of the broad U.S. market, to the acquisitions made by my dollar cost averaging in an automatic retirement account. How will you prepare? Disclosure: I am/we are long VTI. (More…) I wrote this article myself, and it expresses my own opinions. I am not receiving compensation for it (other than from Seeking Alpha). I have no business relationship with any company whose stock is mentioned in this article. Additional disclosure: Information in this article represents the opinion of the analyst. All statements are represented as opinions, rather than facts, and should not be construed as advice to buy or sell a security. Ratings of “outperform” and “underperform” reflect the analyst’s estimation of a divergence between the market value for a security and the price that would be appropriate given the potential for risks and returns relative to other securities. The analyst does not know your particular objectives for returns or constraints upon investing. All investors are encouraged to do their own research before making any investment decision. Information is regularly obtained from Yahoo Finance, Google Finance, and SEC Database. If Yahoo, Google, or the SEC database contained faulty or old information it could be incorporated into my analysis.

The SPDR S&P Global Dividend ETF: Do High Yield Dividend ETFs Reach Too Far?

A globally diversified, passive, total return fund which seeks very high dividend payouts. Several of its heaviest weighted companies pay dividends in excess of net income. Several heavily weighted assets have dividends potentially at risk. We all know the famous biblical anecdote of David interpreting the Pharaoh’s dream. There were to be seven years of plenty followed by seven years of famine. Pharaoh heeded the analysis and prepared the kingdom for the lean years. It’s fair to say that this might have been history’s very first documented investment advice. It required discipline to make the right choices at the right time and then stick to a plan. Comparatively speaking one might say that these are lean year for dividends but it certainly won’t remain this way forever. So, how should a retirement portfolio be positioned for both the lean and fat years? One way is to invest in a dividend focused ETF, but the investor must tread carefully here. The idea is not just to get a dividend return, but to also minimize risk. The important at-a-glance metrics to examine carefully are: trailing dividend yields, payout to net income ratio and the strength of cash flow. These three will give an indication of consistency and sustainability of the current dividend. Here’s one example: State Street Global Advisors’ SPDR S&P Global Dividend ETF ( WDIV ) . According to State Street , the fund’s objective is ” to seek to provide investment results that, before fees and expenses, correspond generally to the total return of the S&P ® Global Dividend Aristocrats Index.” The prospectus states that the fund’s strategy is to invest in a subset of the index, being at least 80% invested at all times. Some key rules are: investing in securities having paid increasing or stable dividends for at least ten years, a market cap of at least $1 billion, an average daily trade value of at least $5 million, a non-negative ‘Dividend to Net Income ratio’ and a maximum indicated dividend yield of 10%. Under these rules, the top 100 qualified stocks are selected with no more than 20 companies from any one country. The weightings of individual holdings are capped at 3% and individual country weightings capped at 25%. (source: WDIV ) The top five country weightings accounting for 65.72% of the fund are: United States, 21.59%; Canada, 15.71%; United Kingdom, 14.52%; France, 6.66% and Australia at 6.64%. EU member nations account for 35.08% of the fund. One must also consider that the fund includes companies based in emerging market countries such as South Africa, Thailand, Brazil and Malaysia, comprising 6.26% of the fund. The fund’s prospectus makes no mention of currency hedging, hence there’s a currency risk although the fund’s broad global diversification should mitigate those risks. 29.62% of the fund is held in cyclically defensive sectors: Utilities, 15.33%, Consumer Staples, 11.22% and Health Care, 3.07%. Those sectors most affected by economic cycles comprise 36.7% of fund: Financials, 25.45%, Consumer Discretionary, 7.74% and Materials, 2.98%. Lastly, 34.21% are held in semi-cyclicals (or cyclically sensitive), 11.65% in Industrials, 10.13% in Energy, 8.36 in Telecom Services and 4.07 in IT. (source: WDIV ) The following gives a snapshot of the top ten holdings with yields and dividend statistics. HollyFrontier Corp (NYSE: HFC ), the fund’s top holding at 2.61%, is a U.S. based petroleum refiner, processing 443,000 barrels per day producing gasoline, diesel, jet fuel, asphalt and lubricants. HFC operates 5 refineries through subsidiaries and also owns a 39% interest in Holly Energy Partners. Its dividend yield is 3.20%, and above the 1.68% industry average in the volatile oil industry. Over the past 5 years its average yield is 3.22%. Its trailing 12 month target payout ratio is high at 155.14% of net income; however, it manages to pay consistently, with a 5 year dividend growth rate of 61.15%. The share price to cash flow multiple is 10.65, well within the average S&P price to cash flow multiple of 14 times. Neopost ( OTCPK:NPACY ), at 1.67% of holdings, is a global provider of mailing solutions, digital communications and shipping services, based in Bagneux, France. The company services 90 countries with subsidiaries in 31 of those. Neopost targets small and midsized companies in Europe although 40% of its business is from North America. To put Neopost in perspective, its primary competitor in the industry is Pitney Bowes . The ADR carries a semiannual dividend of $0.1357, or 7.98% annually. Its dividend yield 9.62% is well above the industry average, 2.65%. Similarly, its 5 year average dividend yield of 7.20% is also well above the industry average at 2.66%. Neopost’s target payout ratio is just over 100% of net income, with a 5 year 1.10% dividend growth rate; the share price to cash flow multiple is 7.61. In other words, Neopost dividend target is 100% of income however manages to sustain and grow their dividend. U.S. based R.R. Donnelley & Sons Company (NASDAQ: RRD ), at 1.63% of holdings. What R. R. Donnelley does may best be described as ‘getting the message across’, through publishing, retail services, digital print, books, magazines, catalogs, inserts, statements and manuals for its clients. Donnelley’s dividend yield of 5.75% is well above the industry average 2.25% yield. Its 5 year 6.67% yield average also tops the industry’s 3.04% average. It needs to be noted that Donnelley’s expected payout ratio is 123.3, indicating that, technically, it’s distributing more than it earns. Over the past 5 years dividend growth is nil and it has a price to cash flow multiple of 4.71, possibly indicating declining revenues and a low share price Coca-Cola Amatil Limited ( OTCPK:CCLAF ), 1.45% of holdings, based in Sydney, Australia. Amatil is Coca-Cola’s bottler and distributor serving the South Pacific region. Amatil’s dividend yield is 3.28%, has a 5 year average yield of 2.28 but, importantly, has a sustainable payout ratio of 77.44% of net income, a 5 year dividend growth rate of 8.72% and priced at a somewhat high 22.42 times cash flow. This is a solid dividend paying holding. Centrica ( OTCPK:CPYYY ), 1.43% of holdings, whose business is in ‘ every stage in the energy chain ‘, from sourcing on the industrial side to servicing on the consumer side. Centrica employs 30,000 in the U.K., Ireland, Europe, North America and Trinidad. Centrica’s dividend yield is 4.91% and has a 5 year average yield 4.84%. Its 5 year dividend growth rate is 1.07%. Due to falling energy prices Centrica cut its dividend to nearly zero. Its expected payout ratio is 0.00%. Shares are priced at 5.99 times cash flow. (click to enlarge) (source: combined) Wm Morrison Supermarkets ( OTCPK:MRWSF ), 1.43% of holdings. As the name implies it’s a retail supermarket chain and offers home delivery. It’s the 4th largest supermarket chain in the U.K. Wm Morrison has fallen on tough times and this is one of the weaker holdings. Shares have fallen 15% in the past 52 weeks. However, Q1 sales did improve and market share remained steady at 10.9%. It will be removed from the FTSE 100 and placed in the FTSE 250. Although the historical statistics indicate that the company paid a 0.5004 semiannual dividend, has a 5 year average dividend yield of 4.48% and a 5 year dividend growth rate of 10.73%, it’s necessary to point out that the company has a negative P/E at -21.65. In March of 2015 the dividend was cut 63%. Hence, a second company in the top ten with an expected 0.00% payout ratio. Currently, it is selling at approximately 4.02 times cash flow Universal Corporation (NYSE: UVV ), 1.42% of holdings, is a global supplier of cured leaf tobacco for consumer tobacco product manufactures. Their services include packing, storing and financing. Universal conducts business in 30 countries and employs 24,000 permanent and seasonal workers. The Company pays a $0.52 share dividend or 3.67% annualized, a 5 year dividend average of 3.97%, a 5 year dividend growth rate of 2.06% and a sustainable expected payout ratio of 47.36%. Shares are priced at 8.95 times cash flow, well inside the S&P average. Not only is Universal a solid dividend paying company, but its target payout ratio has plenty of room to grow. UBM PLC ( OTCQX:UBMPY ), 1.40% of holdings, is a London based marketing, communications and media consultants, specializing in digital services as well as ‘person-to-person’ events, such as trade shows, exhibitions, conferences and live events. Its ADR carries a semiannual $0.16 per share dividend, 3.74% annually, well above the industry average of 1.48%. Its 5 year average yield is 3.97% with a 5 year dividend growth rate of 2.06%. The payout ratio is a very sustainable 47.36%. It recently announced a dividend of $0.24. The company has also been recently upgraded by leading analyst, for example Societe Generale ( OTCPK:SCGLY ) and BNP Paribas ( OTCQX:BNPQY ), to ‘buy’. UBM’s expected payout ratio is 58.26% of earnings and is priced at 12.40 time cash flow. The sustainable payout ratio, analyst upgrades and cash flow multiple within the S&P’s average makes it a solid holding. Williams Companies (NYSE: WMB ), Inc., 1.38% of holdings, is a U.S. based and recognized by Forbes as the most admired energy company for 2015. It is a supplier of liquid natural gas, olefins used in plastics production, owns interstate natural gas pipelines and processes oil-sands. Williams Companies provides services through subsidiaries such as Transco , Gulfstream and Northwest Pipeline . The company pays a quarterly dividend of $0.59 per share, annualized to about 4.86%, a 5 year average yield of 3.24%, a very notable dividend growth rate of 26%, a sustainable payout ratio of 76.96% of net income and trades at 10.36 times cash flow. Williams is a well-founded dividend paying asset. New York Community Bancorp Inc. (NYSE: NYCB ) at 1.36% of holdings, is a New York State Charted Bank Holding Company of New York Community Bank and New York Commercial Bank . These subsidiaries service both consumers and business banking needs in New York City, New Jersey, Florida, Ohio and Arizona. The holding company pays a quarterly dividend of $0.25, about a 5.85% annual yield, a strong 5 year average yield of 6.48%, but having no dividend growth over those 5 years compared to the industry average of 18.04% dividend growth. Its expected payout ratio is high but sustainable at 90.92% and trades at 15.84 times cash flow, slightly above the S&P average. With an improving U.S. economy, particularly in the Florida housing market, it may well be worth the risk. (click to enlarge) The fund is diversified with 102 holdings and a dividend yield of 3.95%; 3.84% less fees and expenses. The recent fixed income selloff may have contributed to the -2.40% one month return. Year to date the fund returned 3.30% and since inception, 9.21%. The average top ten cash flow multiple is 10.3. This may be compared with the benchmark MSCI S&P ® Global Dividend Aristocrats Index yield of 4.61% and a price to cash flow multiple of 8.17. The fund’s FY1 P/E ratio is 15.30, identical with the index as well as the 5 years earnings growth of 5.44%. The market capitalization of the fund is $63.51 million with 950,000 shares outstanding. Currently the market premium is 0.73% over NAV and total management fees are 0.40% annually. (source: WDIV ) There are similar funds for instance the Guggenheim S&P Global Dividend Opportunities Index ETF (NYSEARCA: LVL ), weighted towards Energy, Financials and Utilities. However, just looking at a few of the most heavily weighted companies revealed payout ratios in the hundreds and several others currently having 0.00% payout targets. Another high yield dividend focused ETF, the First Trust Dow Jones Global Select Dividend Index ETF (NYSEARCA: FGD ), also had similar metrics. Since WDIV is a rule based passively managed fund, one should expect variations as companies are dropped or added to the fund as the rules guided metrics change. Generally speaking, though, there are several heavily weighed components which do pay a high dividend, but those dividends are potentially at risk. Granted, the fund will adjust for that, but the question becomes whether or not the passively managed fund will make those changes in a timely manner. The investor must keep the goal in mind and what the alternatives are. The most secure assets like U.S. Treasuries, AAA rated foreign sovereign or even the largest most solidly founded corporations are very highly priced, hence have lower yields. Paying up for such small returns is not a good strategy, especially when a correction is almost certain to happen when the major central banks unwind their QE programs. Similarly, just reaching for the highest yields without regard to risk will lead to similar ‘negative’ results. High yielding ETFs might be okay if an investor has available ‘risk capital’, but generally, these funds seem to be reaching a little too far out on the limb to stake a major portion of one’s capital in the interim. Editor’s Note: This article discusses one or more securities that do not trade on a major U.S. exchange. Please be aware of the risks associated with these stocks. Disclosure: I/we have no positions in any stocks mentioned, and no plans to initiate any positions within the next 72 hours. (More…) I wrote this article myself, and it expresses my own opinions. I am not receiving compensation for it (other than from Seeking Alpha). I have no business relationship with any company whose stock is mentioned in this article. Additional disclosure: CFDs, spread betting and FX can result in losses exceeding your initial deposit. They are not suitable for everyone, so please ensure you understand the risks. Seek independent financial advice if necessary. Nothing in this article should be considered a personal recommendation. It does not account for your personal circumstances or appetite for risk.

Backtesting With Synthetic And Resampled Market Histories

We’re all backtesters in some degree, but not all backtested strategies are created equal. One of the more common (and dangerous) mistakes is 1) backtesting a strategy based on the historical record; 2) documenting an encouraging performance record; and 3) assuming that you’re done. Rigorous testing, however, requires more. Why? Because relying on one sample-even if it’s a real-world record-doesn’t usually pass the smell test. What’s the problem? Your upbeat test results could be a random outcome. The future’s uncertain no matter how rigorous your research, but a Monte Carlo simulation is well suited for developing a higher level of confidence that a given strategy’s record isn’t a spurious byproduct of chance. This is a critical issue for short-term traders, of course, but it’s also relevant for portfolios with medium- and even long-term horizons. The increased focus on risk management in the wake of the 2008 financial crisis has convinced a broader segment of investors and financial advisors to embrace a variety of tactical overlays. In turn, it’s important to look beyond a single path in history. Research such as Meb Faber’s influential paper “A Quantitative Approach to Tactical Asset Allocation” and scores of like-minded studies have convinced former buy-and-holders to add relatively nimble risk-management overlays to the toolkit of portfolio management. The results may or may not be satisfactory, depending on any number of details. But to the extent that you’re looking to history for guidance, as you should, it’s essential to look beyond a single run of data in the art/science of deciding if a strategy is the genuine article. The problem, of course, is that the real-world history of markets and investment funds is limited-particularly with ETFs, most of which arrived within the past ten to 15 years. We can’t change this obstacle, but we can soften its capacity for misleading us by running alternative scenarios via Monte Carlo simulations. The results may or may not change your view of a particular strategy. But if the stakes are high, which is usually the case with portfolio management, why wouldn’t you go the extra mile? The major hazard of ignoring this facet of analysis leaves you vulnerable. At the very least, it’s valuable to have additional support for thinking that a given technique is the real deal. But sometimes, Monte Carlo simulations can avert a crisis by steering you away from a strategy that appears productive but in fact is anything but. As one simple example, imagine that you’re reviewing the merits of a 50-day/100-day moving average crossover strategy with a one-year rolling-return filter. This is a fairly basic set-up for monitoring risk and/or exploiting the momentum effect, and it’s shown encouraging results in some instances-applying it to the ten major US equity sectors, for instance. Let’s say that you’ve analyzed the strategy’s history via the SPDR sector ETFs and you like what you see. But here’s the problem: the ETFs have a relatively short history overall… not much more than 10 years’ worth of data. You could look to the underlying indexes for a longer run of history, but here too you’ll run up against a standard hitch: the results reflect a single run of history. Monte Carlo simulations offer a partial solution. Two applications I like to use: 1) resampling the existing history by way or reordering the sequence of returns; and 2) creating synthetic data sets with specific return and risk characteristics that approximate the real-world funds that will be used in the strategy. In both cases, I take the alternative risk/return histories and run the numbers through the Monte Carlo grinder. Using R to generate the analysis offers the opportunity to re-run tens of thousands of alternative histories. This is a powerful methodology for stress-testing a strategy. Granted, there are no guarantees, but deploying a Monte Carlo-based analysis in this way offers a deeper look at a strategy’s possible outcomes. It’s the equivalent of exploring how the strategy might have performed over hundreds of years during a spectrum of market conditions. As a quick example, let’s consider how a 10-asset portfolio stacks up in 100 runs based on normally distributed returns over a simulated 20-year period of daily results. If this was a true test, I’d generate tens of thousands of runs, but for now let’s keep it simple so that we have some pretty eye candy to look at to illustrate the concept. The chart below reflects 100 random results for a strategy over 5040 days (20 years) based on the following rules: go long when the 50-day exponential moving average (NYSEMKT: EMA ) is above the 100-day EMA and the trailing one-year return is positive. If either one of those conditions doesn’t apply, the position is neutral, in which case the previous buy or sell signal applies. If both conditions are negative (i.e., 50-day EMA below 100 day and one-year return is negative), then the position is sold and the assets are placed in cash, with zero return until a new buy signal is triggered. Note that each line reflects applying these rules to a 10-asset strategy and so we’re looking at one hundred different aggregated portfolio outcomes (all with starting values of 100). The initial results look encouraging, in part because the median return is moderately positive (+22%) over the sample period and the interquartile performance ranges from roughly +10% to +39%. The worst performance is a loss of a bit more than 7%. The question, of course, is how this compares with a relevant benchmark? Also, we could (and probably should) run the simulations with various non-normal distributions to consider how fat-tail risk influences the results. In fact, the testing outlined above is only the first step if this was a true analytical project. The larger point is that it’s practical and prudent to look beyond the historical record for testing strategies. The case for doing so is strong for both short-term trading tactics and longer-term investment strategies. Indeed, the ability to review the statistical equivalent of hundreds of years of market outcomes, as opposed to a decade or two, is a powerful tool. The one-sample run of history is an obvious starting point, but there’s no reason why it should have the last word.