Tag Archives: marketplace

Cash Is King: Was It Ever True?

The phrase “Cash is king,” has become a rather ubiquitous part of financial vernacular. I did some research on who first coined the phrase, and while not particularly clear, one source credits the former CEO of Volvo as first uttering the line in 1988. In any case, “cash is king” describes the general power of the asset , its stability, and means to many ends as a financial tool. Despite its weakness as a productive investment today in an era of low interest rates, cash is still a storehouse of value in a global market where equities, bonds , and real estate seem to dominate most portfolios. However, for those that have sold out of or avoided securities markets for the past several years, holding majority positions in cash has presented severe opportunity cost. Sitting on cash instead of holding stocks, bonds , or other assets has not necessarily been the best of timing decisions. Of course sometimes it takes several years for a timing call to play out. Who’s to say that in another five years stocks will be 35% lower, bond yields will be significantly higher, and the only smart play, in hindsight, would have been to hold cash. But, if you are indeed holding a preponderance of cash today, the thought of whether the train will ever return to the station could quite possibly be haunting you at the moment. The longer the bull runs, the more painful and disconcerting it may be to hold true to a cash-heavy thesis and wait patiently for stocks, bonds, or both to become cheap in one’s eyes. Further, with yields inferior to normal annual inflationary pressures in the 1-3% range, idle cash is also losing purchasing power. That may or may not be a tolerable situation for the average investor to endure. So I would argue that the allure of cash as a regal asset has certainly lost some of its sparkle given the recent annals of market history and this era of ZIRP. The incrementally weaker cash seems to be from an investment perspective, the higher the valuation that is placed on other assets. The irony of the matter is that the American dollar, on a global level, has become much stronger over the past year while cash, in and of itself, continues to languish as a coveted asset. The decision of how much cash to hold in today’s market may be one of the most troubling questions for investors. While the sanest thing to do may be to hold a lot of it, given seemingly excessive valuations in equities and minimal productivity out of bonds, how much opportunity cost can be withstood? Buying a stock with a 3-5% yield and stressed valuation may be the “lesser of two evils,” if holding unproductive cash and generating no income is less desirable. While it may seem like the wise decision now, can you live with a 25-50% implosion of capital when and if the market markedly corrects? If, on the flip side, you continue to opt for sitting on cash, how much “pain” can be endured if stocks head higher and bond yields stay low? At some point, admitting an error in a timing strategy or edging back into securities may prove the more prudent move. Another potential outcome is that stocks remain in a trading range for a significant amount of time without a double-digit percent correction. Again, if you are keeping close tabs on valuations, at what point is it deemed “safe” to get back into stocks. While cash still has many attractive properties, low interest rates and demand for other higher yielding securities has diminished a lot of the glitter oftentimes ascribed to it. A higher interest rate environment may prompt a “re-coronation,” but don’t expect that to happen overnight. In the meantime, holding on to substantial amounts of cash may continue to be a frustrating prospect where king may play second fiddle to court jester as an appropriate characterization of its recent value to investors. Original post
Crisis? Tempted To Flee To Shelter Of Big Funds? Bad Idea

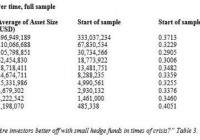
A new report out of the Cass Business School, City University, London, indicates that investors, especially in times of crisis (that is, when the use of the adjective “hedge” in front of “fund” is most apropos), are better off investing with a small fund rather than a large one. This is counter-intuitive, in that it is precisely in times of crisis that the temptation to flee to the larger institutions is most powerful for many investors. Yet the negative statistical correlation between size and performance was largest in three periods within the database of this study, times of crisis: 1999 to 2000, 2003 to 2004, and 2008 to 2010. Why? Largely because of the restrictions that the larger funds place on redemptions. More obviously, diseconomies of scale play a role, and can themselves vary with the business cycle. Size and Time The authors (Andrew Clare, Dirk Nitzsche, Nick Motson) describe their study as based on a more comprehensive database that that of earlier studies along the same lines. Specifically, their database consisted of 7,261 funds and their performance over a twenty year period (1994 to 2014). One important side issue for their study involves the evolution of average industry size over time. Bigger Than It Used to Be (click to enlarge) As the above table shows, the average size of funds has grown, consistently over every decile, through the 20 year period included in the TASS data the authors reviewed. This is what one would expect even before looking at such data, having only a headline-inhabitant’s view of the industry, but it does highlight the issue of whether and to what extent the size/performance relationship itself has varied over the years. Another counter-intuitive finding to emerge from their study: age is also negatively correlated with performance. This seems odd because common sense might indicate that a small fund that has been around for several years (and has remained small) is a fund that has failed to attract investors, likely in turn because it has failed to perform. A large fund may well be a fund that became large because of performance and thus new investment. So … why the negative correlation here? The authors don’t offer a hypothesis. Time and Context They do say, though, that the age/performance relationship is considerably less impressive than the size/performance relationship. Here, again, one has to look at the development of the industry over the 20 years discussed in order to develop a sense of the context for the relationships found in the data. The age/performance relationship was statistically significant in the earlier years of the study’s sample, but by the period since 2003, especially since 2009, this relationship has become “not significantly different from zero.” So the authors focus on the stronger relation of the two they have identified, that between size and performance, and they look at it strategy by strategy, for L/S Equity, Emerging Markets, Event Driven Funds, and Managed Futures. They find considerable variation by strategy. In particular, Managed Futures don’t follow the general rule at all, the relationship between size and performance is positive in that context. It is positive in a way that doesn’t appear “statistically different from zero,” but still … it is not negative. That indicates “that this strategy is less constrained than others by size.” On the other side, the strategy that makes the greatest case for the proposition that petite is sweet is: L/S Equity.

Timing Is Everything

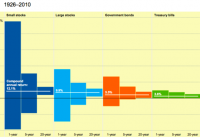
The length of time investors have to plan for is the single most powerful factor in their investment process. If time is short, investments with the highest potential return are the least desirable, because they entail the greatest risk. But given enough time, assets that appear risky become desirable. Time transforms investments from least attractive to most attractive – and vice versa. Our time horizon has a major impact on our investment strategy. This is true in the natural world as well. I’ve been to the coastal redwoods in California, and they’re awesome. John Steinbeck called them “ambassadors from another time.” In many ways, they are. They regularly reach ages of 600 years or more, and some are over 2000 years old. Their natural resistance to disease and insects allows them to grow slowly and gradually. But they have to. The high rainfall in their coastal habitat leaves the soil with few nutrients. By contrast, stumbling into a thicket of pin cherries in the Northeast woods can leave you breathless, but in a different way. The undergrowth can be so thick it’s easy to get disoriented. Pin cherry trees sprout and grow quickly, taking advantage of any disturbance in the forest canopy. But they only live 20 to 40 years, and they’re an important source of food for many types of animals. It would be foolish to say that either tree is more successful. Each has adapted to its environment. What works in one context doesn’t work in another. That’s why, for investors, the typical time period we use to calculate returns – one year – may be misleading. A single year simply doesn’t match the time available to different investors with their differing objectives and constraints. Different assets – and asset mixes – are appropriate in different circumstances. (click to enlarge) Average return and dispersion of return for various asset classes over different time periods, 1926-2010. Source: Jay Sanders, CPA So if you’re worried about the market, be sure to ask yourself how much time you have until you need the money. Because the quickest way to turn a temporary fluctuation into a permanent loss is to sell the asset. Share this article with a colleague