Tag Archives: utilities

Diversified Royalty: Finally, It Is Diversified

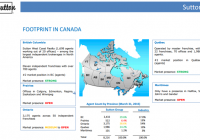
Summary Diversified Royalty transitioned from a capital pool to a royalty stream vehicle in June 2014. BEVFF took steps to prepare its capital structure to add additional royalty streams in the most cost-effective manner. Following a delay after the initial fundraising, BEVFF added a second lucrative royalty stream in early June 2015, truly diversifying itself. Diversified Royalty ( OTC:BEVFF ) (or DIV on the TSX Exchange) came into being on June 30, 2014 when a former capital pool, Benev Capital Inc., put together a transaction to acquire $12m in annual topline revenue for the purchase price of $103m ( $82m USD ) in the form of a royalty stream of income from Calgary-based Franworks Franchise Corp., the owner of the Original Joe’s, State and Main, and Elephant and Castle restaurant chains. Streaming transactions have been common in the basic materials sector for some time, utilizing with great success by Franco Nevada (NYSE: FNV ) and Silver Wheaton (NYSE: SLW ), to name a few. They serve to provide funding for business initiatives without utilizing formal debt instruments. In fact, they partially tie the vendor to the sustainability of the enterprise going forward. Due to their success in the materials sector, these transactions have gained some traction in other sectors as well, as diverse as restaurants and farming. The Franworks transaction was structured as follows: $64m ( $51m USD ) cash on hand Franworks was issued approximately 9m shares worth $14.9m ($12m USD) Maxam Opportunities LP, a venture fund, subscribed for 5.2m shares or $8.7m ($7m USD) in a private placement $15m ($12m USD) coming from borrowings Franworks’ position in DIV amounted to 16.9% of the company at the time of the deal (now 15.4% after some other transactions) so they are very vested in the success of DIV as well. Franworks has the funds from the royalty sale to accelerate growth of its brands by adding new locations, as well as by renewing older locations. Both these help to drive revenue and should provide growing royalties to DIV down the road. Franworks’ restaurants are in the “upscale, casual” dining space. This is where you pay close to upscale dining prices, but without the dress code required. Go in to any of these restaurants and you will see people dressed up for a nice night out sitting next people just off the beach in tank tops and flipflops. The margins are much better than most mass eateries while still having a broad appeal. Maxam Capital Management, the manager of the Maxam Opportunities Fund, uses an “active, opportunistic and flexible” approach to capital management. DIV’s CEO, Sean Morrisson, is also a Managing Partner at Maxam and has a very strong background in capital management, advising the Keg Restaurants, a restaurant royalty income fund in Canada (KEG.UN), among other activities in his venture capital career. Maxam is a good partner for DIV to have in expanding its business, both to generate leads as well as to help evaluate transactions initially and on an ongoing basis. The restaurant-based royalty stream transactions are quite common in Canada with several others utilizing the income fund structure, such as the A&W Revenue Royalties Income Fund (AW-UN.TO), the Boston Pizza Royalties Income Fund (BPF-UN.TO) and the Keg Royalties Income Fund (KEG-UN.TO). DIV is not setup as an income fund, which makes it more flexible to acquire new streams of income down the road, as there are some limitations with the tax structure for income funds. As well, they can simulate the tax-free structure by utilizing its $35m CAD ($28m USD) in tax losses. Like these other royalty funds, the Franworks royalty is a gross revenue royalty, earning 6% of the top-line revenue from the restaurants included in the pool. These can change over time as locations are added or subtracted. Some royalty streams are based on net revenues, where some deductions are taken prior to payment, but DIV will receive its royalty regardless of how profitably the locations are operated. That said, it is clearly to their advantage to have successful restaurants available in the future. DIV’s future is clear: The royalty acquisition from Franworks is a platform transaction for BCI and the first step in our recently announced strategy to purchase top-line royalty streams from a number of growing multi-location businesses and franchisors. Franworks is a fast growing chain with strong unit-level economics and a superb management team – key success factors for a top-line royalty acquisition. With the successful completion of this transformational transaction, BCI intends to focus its efforts on acquiring additional royalties from growing multi-location businesses and franchisors. In October 2014, DIV received final approval for the transaction and completed its name changed to Diversified Royalty Corp. This followed quickly with a promotion of the company on to the TSX big board , providing it a better avenue to raise equity funds than they would have had with a Venture Exchange listing. They quickly utilized this, closing a $34.5m bought deal financing in November 2014 ($27.6m USD). Now all they needed was another royalty stream. So shareholders waited. And waited. And waited. Message boards on stock forums complained about DIV’s lack of action. Analysts on business TV poked fun at its name “how can it be Diversified with just one royalty stream.” On April 1, 2015, DIV added 5 new restaurants to its Franworks deal, increasing annual royalties by $0.6m ($0.5m USD) annually, at a consideration of $6.2m ($5.0m) , $4.8m ($3.9m USD) payable upfront in DIV shares, valued at $2.69 CAD ($2.15 USD), with the remainder due in a year depending on performance of these locations. However, this didn’t move the needle for most shareholders. However, patience was rewarded as on June 9, 2015, DIV announced it had purchased its second royalty stream from real estate company Sutton Realty. (click to enlarge) Sutton is a very strong realtor brand in Canada and has had a relatively stable level of agents throughout the past decade, despite not having the funding available to acquire smaller brokerages or to grow organically. This transaction with DIV will allow it to jumpstart its growth, which will be a positive for both Sutton and DIV. DIV receives, in exchange for $30.6m ($24.5m USD), a fixed royalty payment for licensing the Sutton brand back to Sutton of $3.5m ($2.8m USD) annually plus a $100,000 CAD ($80,000 USD) annual management fee. The royalty payment escalates 2% each year, the management fee 10% every four years and the entire deal is for 99 years. This fee has 40% coverage by Sutton based on EBITDA so there is a good margin of safety to ensure DIV receives their fees each year. Sutton can increase the rate by 10% on four occasions during the life of the deal or choose to add additional agents to the pool in exchange for further investment by DIV based on a pre-set formula. DIV will fund this transaction using $24.3m ($19.4m USD) in cash and an additional $6.3m in debt. This will leave DIV with a roughly $10m ($8m USD) cash on its balance sheet with debt of $21m ($16.8m USD) , a small portion compared to its equity valuation and covered by its future cashflows. Going Forward In its presentation to shareholders, DIV provided the following competitor analysis and forecasted cashflow coverage: (click to enlarge) The first 5 royalty companies all are strictly food-based royalty companies, while Alaris is significantly more diversified than the others. DIV is more hedged with its two current streams than the restaurant only funds, though not as much as Alaris. Its 6.9% dividend yield is significantly higher than the mean of 5.5%. These payouts are made monthly rather than quarterly like most dividends so they are in your hands sooner. The high payout rate is common with these types of corporate structures, as shown above. In some cases, high dividends can be a sign of trouble at the company as the market doesn’t believe they are sustainable; however, in this case it is due to a lack of market awareness. DIV has only one quarter as a royalty company, and this is only with the Franworks royalty stream. However, I wanted to see if they were roughly on track. From the first quarter 2015 MD&A: While they clearly paid out more than planned in this quarter, several extra events impacted the result: $700K CAD ($560K USD) in costs associated with litigation from a former CEO (who left the company in 2004, long before the business model change) $300K ($240K USD) in financing related costs $400K ($320K USD) in taxes; the company has losses that will be applied going forward to minimize these costs. I don’t believe the 2015 first quarter excess distribution over distributable cash is a concern. DIV has undergone a very drastic transformation and will have some costs associated with this, which should normalize in the next couple of quarters. The fact that revenue delivered as expected, despite economic headwinds in the Alberta oil patch, is positive. DIV should also see some economies of scale when the Sutton royalty starts to show up in its results. DIV is not without some risk. Most of the Franworks locations are in Western Canada, which makes it somewhat susceptible to the fortunes of the oil patch; that said, Q1 gives a pretty good indication that they should not be significantly affected by this as this was when the oil price drop was most severe. The frothiness of Canadian real estate is also well known . If there were a downturn in housing, eventually you would likely see some agents take down their shingles. That said, Sutton has maintained its levels of realtors consistently over the past decade so they likely wouldn’t need to retrench much in a downturn. The coverage provided by the EBITDA levels also will ensure Sutton makes its minimum payments to DIV. DIV gives an investor diversified exposure to the Canadian consumer with steady, growing businesses that hit two of the necessities of life — food and shelter, all while receiving an above-average yield ( 6.9% ). Well worth the wait. All figures in CAD, except where indicated. Editor’s Note: This article covers one or more stocks trading at less than $1 per share and/or with less than a $100 million market cap. Please be aware of the risks associated with these stocks. Disclosure: I am/we are long BEVFF. (More…) I wrote this article myself, and it expresses my own opinions. I am not receiving compensation for it (other than from Seeking Alpha). I have no business relationship with any company whose stock is mentioned in this article.

CMS Energy Has Good Long-Term Prospects But Substantial Short-Term Hurdles

Summary Natural gas and electric utility CMS Energy’s share price has underperformed YTD after several years of outperforming both the utilities sector average and the S&P 500. The company possesses multiple long-term earnings drivers such as a favorable regulatory structure, a rebounding service area economy, and the presence of low energy prices. In the short-term, however, the company is faced with the combination of a heavy debt load and the prospect of rising interest rates. While I believe the company’s long-term drivers outweigh short-term hurdles for investors with lengthy investment horizons, its shares will likely be available for still less in the coming year. The share price of utility holding company CMS Energy (NYSE: CMS ) has been one of the top performers in the utility sector since the beginning of FY 2010, solidly beating both the sector as well as the S&P 500 (see figure). Value investors haven’t been provided with many opportunities in recent years to invest in the firm, however, due to the relative lack of undervaluation resulting from price downturns. The company’s share price has taken its largest tumble since the 2008 financial crisis in recent months, potentially making the company an attractive option for value investors. This article evaluates CMS Energy as a potential value investment in light of its recent earnings performance and current outlook. CMS data by YCharts CMS Energy at a glance CMS Energy is a Michigan-based public utility that provides electricity, nuclear power, uranium, and natural gas to customers throughout the state, including the Detroit metro. Its primary business segment is Consumers Energy, which as a regulated utility provides natural gas and electricity to more than 6 million customers, with coverage including the Upper Peninsula, via 6,000 MW of electricity generation capacity and 2,600 MW of power purchase agreements. The majority of its electric customers are residential, with the combination of residential and commercial customers contributing 84% of its electric gross margin in FY 2014. The utility generates electricity from a variety of fossil and renewable sources. In FY 2014 its portfolio consisted of 34% coal, 32% natural gas, 11% pumped storage, 9% renewables, 8% nuclear, and 6% oil. Recent state and federal regulations discourage the use of coal to generate electricity on environmental and human health grounds have caused CMS Energy to move away from the fuel, and by 2017 it expects Consumers Energy’s portfolio to be comprised of 37% gas, 24% coal, 12% pumped storage, 10% renewables, 8% nuclear, 6% oil, and 3% purchased. CMS Energy also conducts business via CMS Enterprises, which engages in independent power production and natural gas transmission. Consumers Energy generates the overwhelming majority of its parent company’s earnings, or 97% in Q1 2015. CMS Energy suspended its dividend during the financial crisis but reinstated it during the subsequent recovery and has become a reliable dividend generator in recent years, increasing its quarterly amount from $0.15 in FY 2010 to $0.29 today. The most recent increase from $0.27 of 7% was declared at the beginning of this year, bringing its forward yield at the time of writing to 3.6%. The company expects to maintain annual dividend growth of 5% over the next several years which, given its past record, is a feasible goal barring another major economic meltdown in Michigan. Q1 earnings report CMS Energy reported its Q1 earnings report in late April, missing on the top line and beating on the bottom. Revenue came in at $2.1 billion, down 16.3% from $2.5 billion (see table) and missing the consensus analyst estimate by $250 million. The decline was mostly due to the presence of much lower natural gas prices in Q1 2015 than in Q1 2014, which drove the average price charged to customers down by 60% compared to Q1 2005. Operating income fell by only 2.7% YoY to $397 million, however, due to a 19% operating expense decline YoY (again the result of low natural gas prices) almost entirely offsetting the revenue reduction. Q1 net income remained virtually unchanged, declining very slightly from $204 million to $202 million. This resulted in a diluted EPS number of $0.73, down slightly from $0.75 YoY but beating the consensus by $0.05. While the adoption of new mortality tables and a lower discount rate resulted in a hit to EPS of $0.08, the impact of these adjustments was more than offset by a $0.14 gain resulting from a very cold winter, with record natural gas and electricity sales recorded in February, and $0.04 from cost-cutting efforts. The YoY reductions to net income and EPS were largely the result of even colder weather being present in Q1 2014 and its most recent earnings were actually up 7% on a weather-normalized basis; overall Q1 2015 was the company’s 2nd-best result in at least a decade. CMS Energy Financials (non-adjusted) Q1 2015 Q4 2014 Q3 2014 Q2 2014 Q1 2014 Revenue ($MM) 2,111.0 1,758.0 1,430.0 1,468.0 2,523.0 Gross income ($MM) 983.0 852.0 775.0 746.0 948.0 Net income ($MM) 202.0 96.0 94.0 83.0 204.0 Diluted EPS ($) 0.73 0.35 0.34 0.30 0.75 EBITDA ($MM) 626.0 438.0 396.0 380.0 610.0 Source: Morningstar (2015). CMS Energy’s management reaffirmed its FY 2015 EPS guidance of $1.86-$1.89 in the wake of the earnings report’s release given the strength of the quarter. The company ended Q1 with $522 million in cash (see table), less than in Q1 2014 but still substantial in light of its asset growth and dividend increase. Its current ratio remained unchanged YoY at 1.6 while its interest coverage ratio remained solid at 2.8. Its balance sheet remains a concern, however, due to the large amount of long-term debt in the liabilities column. This increased by another $600 million over the previous four quarters to $8.1 billion at the end of Q1. While the debt is rated well, with S&P giving its secured and unsecured debt ‘A’ and ‘BBB’ ratings, respectively, its sheer size alone generated interest expenses in Q1 equal to 20% of the company’s operating income. CMS Energy Balance Sheet (restated) Q1 2015 Q4 2014 Q3 2014 Q2 2014 Q1 2014 Total cash ($MM) 522.0 207.0 493.0 358.0 758.0 Total assets ($MM) 19,198.0 19,185.0 18,381.0 17,719.0 17,924.0 Current liabilities ($MM) 1,599.0 2,014.0 1,648.0 1,563.0 1,801.0 Total liabilities ($MM) 15,396.0 15,515.0 14,711.0 14,074.0 14,306.0 Source: Morningstar (2015). Outlook CMS Energy’s outlook is a mixed bag, with positive long-term drivers being offset by negative short-term hurdles. The first of the positive drivers is the economic rebound that the state of Michigan is currently undergoing following Detroit’s bankruptcy. The state’s unemployment has fallen at a faster pace than the U.S. average rate (see figure) and the two are now equal. Furthermore, Michigan’s construction industry is bouncing back and construction payrolls have grown at twice the rate over the last five years of the U.S. average, signifying new buildings and therefore new utilities customers. The combination of increased electricity demand in particular and restrictions on coal-fired facilities has created a capacity shortfall within the state that is only expected to increase with time. Recognizing that this problem can only be solved via additional capacity, the company is moving forward with regulatory approval for the acquisition of a new natural gas-fired facility, which will in turn strengthen the company’s argument for future rate increases as compensation. There is a risk, of course, that regulators will instead opt to use power purchase agreements from 3rd-party generators, on which CMS Energy recognizes no profit, to cover the shortfall. This is mitigated by the second short-term driver: Michigan’s energy policy. Michigan Unemployment Rate data by YCharts Michigan’s legislature joined many other states earlier in the century by implementing a renewable portfolio standard that, among other things, required the state’s utilities to achieve a retail supply portfolio of 10% renewable electricity by 2015. That year has arrived, however, and Michigan has not extended and increased its RPS target. Instead its legislature is in the process of implementing a new energy policy that will instead utilize Integrated Resource Plans. Under these IRPs utilities propose multi-year forecasts of supply and demand alongside the most cost-effective means of meeting the forecasts. Utilities frequently prefer IRPs to RPSs since the latter are imposed on them whereas the former are largely directed by them. Some regulatory uncertainty can be expected to occur since IRPs don’t have the multi-decade horizons of RPSs, but CMS Energy’s recent investor presentations have supported the former despite this downside. IRPs are important from the perspective of capacity shortfalls since they allow traditional utilities to meet the shortfall via the types of capacity that they are most familiar with, such as natural gas-fired facilities, rather than via less established pathways such as renewables. Michigan already operates under a favorable regulatory system, with regulators recently permitting CMS Energy a ROE of 10.3% (which was admittedly less than the company had requested) and the replacement of Michigan’s RPS with an IRP framework could make this system still more favorable. The continued presence of low natural gas and coal prices can be expected to benefit CMS Energy further still (see figure). The company has already begun to pass its cost savings for both onto its customers in the form of lower retail prices, and regulators will likely view its future rate increase requests more favorably than they otherwise would as a result. Furthermore, low natural gas prices will encourage increased consumption, supporting its transmission and distribution operations. The company already intends to add another 170,000 natural gas customers in coming years via transmission capacity investments, and increased consumption per customer due to low prices will support this further still. The company also intends to increase its owned electricity generating capacity to 8,820 MW over the coming decade as its existing power purchase agreements expire, providing its electricity operations with additional income. CMS Energy should have little difficulty achieving 5% annual EPS growth over the next several years (management hopes to achieve an annual growth rate of up to 7%) based on these investments so long as Michigan’s economy remains steady. Michigan Natural Gas Citygate Price data by YCharts The short-term hurdle that worries me the most, however, is CMS Energy’s heavy long-term debt load and relatively high interest expenses even in the current low interest rate environment. This burden has the potential to grow even heavier in the next few quarters due to the likelihood that the Federal Reserve will increase interest rates for the first time in almost a decade. Shares of dividend stocks, utilities included, have moved broadly lower this year (see figure) in anticipation of higher interest rates as investors prepare to move into government and corporate bonds. While CMS Energy’s share price has underperformed the Dow Jones Utility Average since both peaked in late January, the difference is slight enough to suggest that the second affect of higher interest rates – larger interest payments for firms such as CMS Energy with heavy debt loads – isn’t entirely being factored in yet. The company intends to incur at least 50% more capital expenditures in the coming decade than in the last ten years, suggesting that its debt load will remain large for the foreseeable future. I expect that its share price will fall further when interest rates finally rise. CMS data by YCharts Valuation Analyst estimates for CMS Energy’s diluted EPS in FY 2015 and FY 2016 have remained unchanged over the last 90 days as the company’s management reaffirmed its EPS guidance. The FY 2015 consensus estimate is $1.88 while the FY 2016 consensus estimate is $2.01. Both results would, if achieved, represent the company’s best performance since at least FY 2000, indicating that analysts currently assume the presence of very favorable operating conditions over the next six quarters. Based on the company’s share price at the time of writing of $31.59, it has a trailing P/E ratio of 18.1x. Its FY 2015 and FY 2016 consensus estimates yield forward P/E ratios of 16.8x and 15.7x, respectively. While off of their January highs, all of these ratios are still well above their lows since 2012 (see figure). The company’s shares appear to be fairly-valued, if not slightly overvalued, based on their historical valuation range. CMS PE Ratio (NYSE: TTM ) data by YCharts Conclusion CMS Energy has much to offer to those investors looking for safe, dividend-bearing investments: an impressive share price track record, several years of sustained dividend and EPS increases, and a large presence in a rebounding economy that is overseen by a favorable regulatory system. Those investors with a multi-year investment horizon could certainly do worse than to initiate a long investment in the company at its current share price. I recommend waiting, however, until the first interest rate increase occurs later this year, as I believe that this will cause the company’s share price to decline still further in light of its large debt load and planned capex in the coming years. I expect that patient investors will be able to initiate long positions at 15x the firm’s estimated FY 2016 earnings, or $30.15 based on current forecasts, which would compensate them for the risk borne by the company’s debt load. Disclosure: I/we have no positions in any stocks mentioned, and no plans to initiate any positions within the next 72 hours. (More…) I wrote this article myself, and it expresses my own opinions. I am not receiving compensation for it (other than from Seeking Alpha). I have no business relationship with any company whose stock is mentioned in this article.

Duke Energy Should Be On An Income Investor’s List

The company is streamlining its operations and focus on growth should propel its stock price. Increased revenues and cash flows from growth projects should result in increased dividend growth. Current price represents a good entry point for long term investors. Duke Energy (NYSE: DUK ) has had mixed fortunes over the past five quarters. The revenues and earnings of the company have been fluctuating, which is odd for a large utility like Duke. The trend in the stock price has been consistent with the trend in its revenues and earnings over the last twelve months. It touched $90 in January but could not maintain that level and the stock has been on a declining trend over the last six months. This, I believe, has created a good entry point for income investors. Duke Energy has been repositioning its business by selling its competitive business assets. The company has strategic growth plans that involve getting an extended, renewable energy generation asset base; such plans will benefit the company in the long-run, as the company’s revenue and cash flow growth will improve which will reduce shareholder risk and maintain investors’ confidence in the longer term. The company is seeking an opportunity to invest in Green projects worth $4 billion which will further boost its growth. It has also plans for the accelerated investments in solar, biomass and natural gas. Duke also plans to convert its coal field plants to natural gas ones in order to have larger asset base. However, this is a long-term investment, approximately 4 to 5 years horizon should be kept in mind. It will be a joint venture to service more territories with expanded gas generation. As a result, this huge investment will boost growth that in return will increase revenues and maintain stable cash flow base. This will have a significant positive affect on the DUK’s share price. On the other hand, the recent sale of non-regulated Midwest assets and the subsequent buy back of shares will increase the company’s earnings per share. It will also allow DUK to repay debt and make its financial position stronger. Duke Energy also has plans to access some cash, in the form of unremitted international business earnings, in the next 8 years that will have a positive effect on its performance. This will allow the company to grow its profitable operations and expand its natural gas pipelines in North Carolina, as discussed above, to cater for more demand. Furthermore, the cash from international business segments will finance future growth and create value for its shareholders in the longer term. Duke energy is a good investment for income investors – it yields a return of 4.1%, with dividends paid quarterly. All of the above repositioning strategies will accelerate dividend growth for the shareholders. It will also improve the overall business risk of DUK and make investors more confident as it will also lower the shareholders’ risk. However, the company will remain exposed to the risk of sudden changes in regulatory restrictions. In addition, any carelessness exhibited by company’s management during the execution of its planned investment might hinder its future growth potentials. Furthermore, unforeseen negative economic changes, foreign currency volatility and adverse weather conditions are key risks that might restrict its stock price performance in the years ahead. Duke’s long term prospects look good. However, with the demand growth in the US expected to slow in the coming years, Duke Energy might face some difficulties on the revenues front in the domestic market. As a backup plan, it can still generate growth with its international energy business by focusing on overseas operations. Duke has effectively modified its portfolio with wind and solar power projects lined up for the future. Most importantly, this company also remains committed towards enhancing operational efficiency and cutting down costs to further fuel earnings growth. In conclusion, Duke Energy had a successful 2014, is off to another strong one this year, and if all goes according to the plan, it will pass along another dividend increase to shareholders very soon. The company’s share price is currently following a declining trend, but with revenues and earnings expected to rise due to the growth projects, there is a lot of upside to the share price. For income investors looking for a stable, secure, high-yield investment opportunity, Duke Energy should certainly be considered. Disclosure: I am not a registered investment advisor and the views expressed in this article are my own. These views should not be taken as an investment advice or recommendation to buy or sell the shares. Investors should conduct their own due diligence before making an investment decision. Disclosure: I/we have no positions in any stocks mentioned, and no plans to initiate any positions within the next 72 hours. (More…) I wrote this article myself, and it expresses my own opinions. I am not receiving compensation for it (other than from Seeking Alpha). I have no business relationship with any company whose stock is mentioned in this article.