Tag Archives: ycharts

China’s Bubble: How To Profit

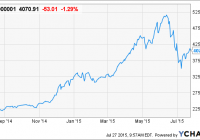
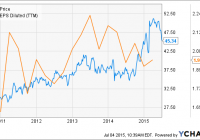
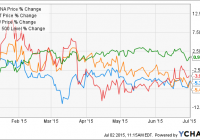
Summary The Shanghai index fell more than 8% today, marking the greatest loss in almost a decade. Investing in China has always been notoriously difficult for foreigners. Fortunately, there are a small handful of inverse ETF’s that allow foreign investors to possibly profit off the Chinese downturn; this article will offer a brief overview of these companies. Introduction One of the few people to get rich in the 1929 crash was a man named Jesse Livermore, or ‘boy plunge’, who made over $100 million during a period when almost everyone else in the industry went broke. In 2006, hedge fund manager John Paulson made one of the most famous bets in Wall Street history when he bet millions against the sub-prime housing market using credit default swaps, which quickly turned him into a billionaire. Did the Chinese stock market just create the next big short-selling opportunity? There is a lot of media coverage with respect to the ‘China Bubble’, however, I could not find anything that offered an overview of the best way to capitalize off of the bubble for the Western investor. This article will offer a brief overview of the performance of the Chinese stock market, but will not go into as much detail as this has been covered before; instead, the focus of this article will be on how to possibly benefit from an overvalued stock market bubble. The China Bubble ^SS000001 data by YCharts Last month, China finally started a much anticipated turn around in their overheated stock market. Much of this fall was in the Shanghai index, which has a lot of the more expensive tech stocks, with very high P/E ratios. Most investors have little to no experience about investing in China as government policies have historically made this difficult, up until loosening of said policies within the last few months. Furthermore, the Chinese government plans to possibly place restrictions on foreign short-selling of Chinese securities, which has further confounded the picture for foreign investors. China’s stock market has been rising without anything slowing it down for several years now; most notably, within the last year the Shanghai index has absolutely exploded by more than doubling in value. It’s important to note that within the last six months, a large number of retail investors have entered the picture in China, seemingly under the premise that the Chinese markets could never go down; this has led to prices surging, especially on the Shanghai index, as many of these poorly educated investors spent money haphazardly. This has led to the stock price deviating significantly from the fundamentals, and created a bubble. A couple of weeks ago that bubble started to burst as the Shanghai index went from above 5000 to 3500; this stall seemed to have stabilized after the Chinese government announced loosening of margin requirements, halted the trading of certain corporations, and facilitated massive amounts of promised investments from large corporations until the Shanghai index hit 4500. This seemed to create some stabilization pressure as the Shanghai index fought to stay above 4000; today the Shanghai index fell more than 8% for it’s largest drop in almost a decade. The Fundamentals The strongest belief that I have with regards to investing is that your decisions should be based on 99% fundamentals, and 1% reading chart trends. Every day I am perplexed by the masses of people who spend hours looking at charts, technical indicators, and ‘doji’s’, without once pulling up the latest quarterly report, reading the news, and crunching the numbers. I don’t understand people that solely make their investment decisions based on how other people chose to buy or sell that stock, over a certain period of time in the past. The 1% of your effort that you should spend on reading charts, is specifically ideal for this type of situation. We know the market is overvalued, yet we don’t know when people will come down to reality. In short, I think that it makes sense to ignore the momentum of a stock and base decisions purely on the fundamentals; however, when it comes to make a riskier short bet it seems logical to look for the momentum indicator to confirm a decision based on the fundamentals. This is because one’s losses are finite in a long, but theoretically infinite in a short. Looking at the fundamentals for China can be quite terrifying. The most touted metric in the media seems to be the absurd price to earnings ratios that are emerging. Furthermore, the average P/E seems to be skewed as there are a large number of banks that are trading at 12 P/E, while technology stocks are trading in the mid 60’s. How to Invest Against China? Most investors tend to purchase stocks in their own currency, and on exchanges in their own country. This is because most people generally feel more comfortable investing in their own currency because they don’t want to deal with the unknown variables such as exchange rates. Also, we tend to get an over proportionate amount of news, and tend to learn more about our own economy, making us more confident to invest. People tend to invest in areas they know more about, which is why amateurs investors tend to invest in fields they work in, or may have an expertise in. This is of course generally a good idea, as you don’t ever want to invest in something before you fully understand a company. I will admit that I am far from an expert in Asian markets, and when I do pay attention to Asia I tend to focus on the macroscopic picture, rather than individual companies. I think hat the vast majority of Western investors think along the same lines, and find it confusing to invest in any one company in Asia. Fortunately, there are exchange traded funds (ETFs) that makes the job a whole lot easier. I’ll go over some of them below. Based on my research I was able to find 3 ETFs that short the Chinese markets, some of them using leverage; this article will offer a brief overview of all three. I think it is important to understand how an ETFs like these work, as it can be quite hard to understand. All of these ETFs are daily inverse ETFs, and therefore should closely match the corresponding index for one day. However, for the leveraged ETF’s, they tend to look much different than the actual index due to the compounding effect of leverage. For example, with a triple inverse ETF, the index could lose 90% of its value in one day, then double the next, resulting in you losing all of your money. It’s important to understand how quickly one can lose or make money with this environment. With the extraordinary manipulation of the Chinese markets, this can be an extremely dangerous trade. The ETFs CHAD data by YCharts ProShares Short FTSE China 50 ETF (NYSEARCA: YXI ) and ProShares UltraShort FTSE China 25 ETF (NYSEARCA: FXP ) The Proshares Short China 50 FTSE is an ETF which is designed to correspond to the inverse of the China 50 FTSE, while the Proshares Ultrashort China 50 FTSE corresponds to twice the inverse. The China 50 FTSE includes the 50 largest stocks on the Hong Kong Stock Exchange, which has almost half of their investments in the finance sector, with under 4% in technology. The table below made available by Proshares outlines their asset distribution. Keep in mind that this index has not been the focus of attention recently. Direxion Daily FTSE China Bear 3x Shares ETF (NYSEARCA: YANG ) The Direxion Daily China Bear 3X Shares ETF is essentially the Proshares ETF on steroids; for the investor with nerves of steel, one can return three times the inverse of the China 50 FTSE. This is the most leveraged Chinese ETF available, but again it corresponds to the top 50 most liquid companies in China, and would not necessarily be the most profitable in the event of a collapse. Direxion Daily CSI 300 China A Share Bear 1X Shares (NYSEARCA: CHAD ) The Direxion Daily CSI China A Bear 1x Shares most recently added Chinese bear ETF, and it directly corresponds to the most controversial index: The China A shares. Chinese A shares are ordinarily restricted to Chinese citizens, and are traded on the Shanghai and Shenzen Stock Exchange; foreign investors must go through the Qualified Foreign Institutional Investor system. Fortunately, we can still take advantage of the situation through CHAD! Although this is not a leveraged ETF, it corresponds to the most volatile part of the Chinese stock market, and may be the most likely to produce the most profit in the event of a downturn. Conclusion Although I still believe that the Chinese markets are inflated, the government intervention makes this far too speculative for me; I bought all three of these ETFs right before the crash last month, and settled them a couple of weeks ago to play it safe. However, for the more aggressive investor, there are still ways to profit off the potential collapse of the Chinese markets. Disclosure: I/we have no positions in any stocks mentioned, and no plans to initiate any positions within the next 72 hours. (More…) I wrote this article myself, and it expresses my own opinions. I am not receiving compensation for it (other than from Seeking Alpha). I have no business relationship with any company whose stock is mentioned in this article. Additional disclosure: Used to own all three but sold a couple of weeks ago.

UIL Holdings: Regulator Opposition Threatens An Attractive Proposed Merger

Summary The share price of electric and natural gas utility holding company UIL Holdings reached an all-time high earlier this year following a proposed merger with international utility Iberdrola. The merger would have been good for UIL Holdings, as the company lacks clear earnings growth potential in the face of slow customer expansion and cheap petroleum prices. The company’s shares are not undervalued in the event that the merger fails, while a revised merger price is likely to be lower than the original one. Potential investors looking for utilities investments will find more attractive options elsewhere in the sector at this time. Electric and natural gas utility holding company UIL Holdings (NYSE: UIL ) saw its share price tumble last week after regulators in Connecticut issued a draft decision rejecting its proposed merger with the U.S. subsidiary of European utility Iberdrola (OTCPK: IBDSF ). While the final regulatory decision isn’t due for another two weeks, the market is no longer optimistic that the merger will result in a transaction price above $50 for UIL Holdings’ shares, assuming it happens at all. Despite the recent decline, however, the company’s share price valuations remain well above their pre-2015 ranges despite the presence of a multi-year declining trend to earnings (see figure). This article evaluates UIL Holdings as a potential investment in light of these recent events. UIL data by YCharts UIL Holdings at a glance UIL Holdings is a Connecticut-based diversified regulated energy delivery utility that operates in its home state and west Massachusetts. The holding company, which was formed in 2000 and sold its non-utility segments in 2006, has a total of 727,000 natural gas and electric utility customers. These customers are served via the company’s four utility subsidiaries: United Illuminating Co. [UI], Connecticut Natural Gas [CNG], Southern Connecticut Gas [SCG], and Berkshire Gas [BG]. UI distributes electricity to 325,000 customers in Connecticut and has recently invested heavily in expanding and reinforcing its service area via the construction of new transmission lines. The subsidiary sold its electricity generation assets in 2000 and is focused entirely on delivery and related services. CNG distributes natural gas to 165,000 customers in Connecticut and is expanding into the development and implementation of distributed generation technology. Distributed generation, which allows larger customers to use natural gas as a backup to on-site intermittent sources of electricity such as wind and solar power, is becoming increasingly popular on the eastern seaboard. SCG is also a natural gas distribution utility that was purchased in 2010 from Iberdrola and now has 185,000 customers around the Long Island Sound shoreline. Both SCG and CNG own LNG storage facilities in addition to their natural gas network. Finally, BG distributes natural gas to 36,000 customers in the western half of Massachusetts. UIL Holdings saw its share price and earnings both peak in early 2013 and the former proceeded to underperform the broader sector for the next two years (see figure). Unlike many of its peers, the company was caught relatively flat-footed by the shale gas revolution despite its proximity to the Marcellus Shale, from which it currently sources 73% of the natural gas that it distributes. Its LNG storage facilities were quickly rendered less useful as an expected inflow of seaborne LNG was replaced by abundant domestic natural gas. Furthermore, Connecticut, which is home to the large majority of the company’s consolidated customer base, did not see its economy recover from the effects of the Great Recession as quickly as the U.S. average in 2013 and 2014, causing its earnings growth trend to reverse. Its dividend has in turn remained unchanged in nominal terms since Q1 2009, meaning that it has declined by 10% in real terms over the same period relative to inflation. UIL Holding’s primary means of customer growth in recent years has been by convincing existing homes to convert from heating oil to natural gas. While this effort allowed it to add 16,266 customers last year, the sharp fall in the price of petroleum that occurred in that same year means that the company now expects to add only 12,000 new customers this year. It remains reliant on natural gas, the operations of which generated 67% of its consolidated revenue and more than half of its consolidated net income in FY 2014. UIL data by YCharts Recognizing that earnings growth would only resume via an expanded service area, UIL Holdings began in 2014 to explore mergers and acquisitions. In March of that year it agreed to purchase the operations of Philadelphia Gas Works , the country’s largest municipally-owned natural gas utility, for $1.9 billion. While the deal would have provided the municipality with much-needed cash and expanded the company’s consolidated customer based to 1.2 million across three states, the deal fell apart in December following opposition from labor and the Philadelphia city council, both of which believed that the sale price was insufficient. The market clearly thought otherwise, however, as UIL Holdings’ share price resumed its upward trend and set a new all-time high shortly thereafter. This upward trend was provided with a further boost after Iberdrola announced in February 2015 that it had agreed to acquire UIL Holdings for roughly $3 billion, or an average share price of $52.83. The latter’s share price promptly moved above $50 on the news. The merger was presented as a boon to both companies, allowing Iberdrola to expand its U.S. presence and providing UIL Holdings with 2.4 million new customers in two states and access to 6.3 GW of renewable generation capacity, primarily in the form of wind farms. The two sides were unable to convince Connecticut regulators of the deal’s merits, however, and they rejected the proposed merger last week on the dual grounds that UIL Holdings had not provided it with sufficient evidence that its existing customers would benefit under the deal, or that sufficient corporate safeguards would be implemented. While a final decision is not expected until the middle of July, the regulators also rejected a request by UIL Holdings to give it an additional two months to revise its merger application, stating that this would not be a sufficiently-long period of time in which to do so. The regulators instead encouraged the two companies to start their application over again if they want to move forward with the merger. While a subsequent statement by UIL Holdings’ CEO was ambiguous regarding the path forward, it should be noted that the merger would not have been completed until the end of 2015 had regulatory approval been attained, so this roadblock will delay a potential acquisition by another year in the event that the application is restarted. Furthermore, Iberdrola’s revised purchase price will likely be lower than before in the event that it presses on to reflect the higher regulatory costs that a successful acquisition will entail. Q1 earnings report UIL Holdings reported its Q1 earnings in late April and missed on both lines despite the presence of favorable weather conditions during the quarter. Revenue came in at $584.1 million, missing the consensus estimate by $39.8 million despite increasing YoY by 2.3% (see table). The presence of low energy prices and slightly reduced normalized customer demand was slightly offset by customer growth due to conversions from heating oil to natural gas and harsh winter conditions compared to both the previous Q1 and the long-term average. Gross income rose to $292.7 million from $282.2 million the previous year as customer growth and weather-related demand offset a higher cost of revenue. Operating income fell YoY, however, from $104.4 million to $100.1 million. As with other utilities, UIL Holdings incorporated updated mortality tables reflecting longer life expectancies into its pension costs, which rose as a result. UIL Holdings Financials (non-adjusted) Q1 2015 Q4 2014 Q3 2014 Q2 2014 Q1 2014 Revenue ($MM) 584.1 433.0 293.0 334.8 571.2 Gross income ($MM) 292.7 257.0 198.4 206.5 282.2 Net income ($MM) 57.6 32.3 12.5 9.3 55.5 Diluted EPS ($) 1.01 0.56 0.22 0.16 0.97 EBITDA ($MM) 151.3 123.4 76.1 73.0 146.2 Source: Morningstar (2015). Net income rose slightly YoY from $55.5 million to $57.6 million, resulting in a non-adjusted EPS of $1.01 versus $0.97. EBITDA also rose slightly compared to the previous year from $146.2 million to $151.3 million. The company incurred non-recurring expenses of $6.2 million during the quarter relating to its Philadelphia Gas Works acquisition attempt, its proposed merger with Iberdrola, and regulatory reserve requirements. Adjusted EPS rose slightly from $1.09 to $1.12 but missed the consensus by $0.07, marking at least its f ourth consecutive underwhelming result. UIL Holding’s natural gas subsidiaries performed well, with their consolidated net income rising by 6% compared to the previous year due to customer conversions and cold temperatures. Consolidated net income from the electric distribution and electric subsidiaries fell by 19% and 24% YoY, respectively, although they were mostly flat on an adjusted basis. Strong overall demand caused the natural gas distribution subsidiaries to generate 67% of the company’s consolidated operating income, up from 63% the previous year. UIL Holdings’ ended the quarter with $80.1 million in cash, down from $137.4 million due in part to its non-recurring M&A-related expenses. Its current ratio remained relatively steady at 1.5, however. Long-term debt fell very slightly to $1.7 billion but was more than offset by an increase to short-term debt. $282 million of the company’s total debt load will mature by the end of FY 2018. While any renewal of this debt can be expected to carry higher interest rates due to expected rate hikes later this year, the company’s balance sheet is in a decent position due to its BBB S&P credit rating and availability of another $400 million under its existing credit facilities. UIL Holdings Balance Sheet (restated) Q1 2015 Q4 2014 Q3 2014 Q2 2014 Q1 2014 Total cash ($MM) 80.1 115.6 102.8 175.6 137.4 Total assets ($MM) 5,128.3 5,111.9 4,857.7 5,098.0 5,130.2 Current liabilities ($MM) 444.7 495.6 357.9 604.2 615.5 Total liabilities ($MM) 3,724.8 3,743.7 3,498.7 3,726.8 3,745.1 Source: Morningstar (2015). Outlook The possible collapse of the merger with Iberdrola weakens UIL Holdings’ outlook by reducing the prospect of future earnings growth. The company’s annual adjusted EPS guidance for FY 2015 of $2.30-$2.50, affirmed during the Q1 earnings call , is unlikely to be negative affected since the merger wasn’t expected to close until the end of the year. If achieved, even the low end of this range would represent a decade high, reversing its recent annual EPS trend. Non-adjusted EPS for the year could actually improve if the merger does not proceed by eliminating additional M&A-related expenses. Earnings growth beyond FY 2015 will become much more difficult to achieve in the absence of the merger, however, especially if petroleum prices continue to remain low, dampening heating oil conversion efforts. The company does have the advantage of achieving strong ROEs, especially when compared to the ROEs allowed by regulators. The aforementioned regulatory reserve was set up in response to concerns that its achieved transmission ROE will exceed the allowed ROE in FY 2015, for example. This advantage is mitigated somewhat by its lack of expansion plans in the absence of the merger, however, since this will limit the company’s ability to convert its high ROEs into earnings growth. Furthermore, natural gas distribution ROEs are not as favorable, with SCG and CNG both being allowed ROEs that are only in the single-digits (many of its peers are allowed distribution ROEs above 10%). This has limited the company’s overall ROE to 8.1% (see figure), well below the industry average of 10%. UIL Return on Equity (NYSE: TTM ) data by YCharts Valuation Analyst estimates for UIL Holdings’ diluted EPS in FY 2015 and FY 2016 have remained flat over the last 90 days, although I would not be surprised to see the latter consensus decline if the proposed merger fails in the wake of the regulators’ draft decision. The FY 2015 consensus has fallen very slightly from $2.41 to $2.40 while the FY 2016 consensus has increased very slightly from $$2.57 to $2.58. Based on the company’s share price at the time of writing of $45.34, it has a trailing P/E ratio of 19.6x and forward ratios for FY 2015 and FY 2016 of 18.9x and 17.6x, respectively. While all three ratios have declined in recent months, they are still above even the tops of their respective 5-year ranges (see figure). Investors should also note that the merger price was ultimately to be approximately 17.5x the company’s expected FY 2016 EPS. The company’s share price is currently trading at a level that is slightly above this valuation despite the recent price decline. While the merger can still move ahead, I believe that a revised offer would ultimately be lower than the previous one to account for higher-than-expected regulatory costs. Taken together, these indicators suggest that the company’s shares are overvalued at this time. UIL PE Ratio ( TTM ) data by YCharts Conclusion UIL Holdings has seen its share price decline substantially from an all-time high in the lead-up to and wake of a draft decision by Connecticut regulators to prevent the company’s proposed merger with Iberdrola. Despite this decline, however, I do not believe that the company’s shares are an attractive investment at this time. The merger would have provided it with the ability to generate future earnings growth resulting from an expanded customer base, access to renewable electricity, and its high achieved transmission ROEs. A strong purchase price was in turn the result of these expected earnings. The regulators’ decision casts this growth potential into doubt, however, and the purchase price will likely be lower even in the event that the two companies resubmit a new merger application. Furthermore, UIL Holdings does not provide the history of either earnings growth or dividend growth that makes some utilities attractive even in the absence of a clear value investment thesis. I recommend that those potential investors looking to gain exposure to natural gas and electric utilities search elsewhere, as the presence of bearish sentiment in the sector has created a number of interesting opportunities. UIL Holdings is not one of those at this time. Disclosure: I/we have no positions in any stocks mentioned, and no plans to initiate any positions within the next 72 hours. (More…) I wrote this article myself, and it expresses my own opinions. I am not receiving compensation for it (other than from Seeking Alpha). I have no business relationship with any company whose stock is mentioned in this article.

My Top Water Utility Stocks For 2015

Summary In this series of articles, I will be reviewing individual industry sectors and selecting my favorite stock picks for 2015. For Part 53, I will be reviewing the Textiles and Apparel sector, taking a look at revenue/earnings growth and the overall financial stability of the companies. Out of this group of stocks, my top picks are Artesian Resource, California Water Service, and SJW. Overview In this series of articles, I will be taking a look at various industry sectors and selecting what I believe will be outperforming stocks for 2015. In Part 1 , I reviewed 47 stocks within the Aerospace and Defense industry sector. For part 53 (the final part of this series), in determining my favorite stocks in this sector for 2015, I will review the following Water Utility stocks: American States Water (NYSE: AWR ) American Water Works (NYSE: AWK ) Aqua America (NYSE: WTR ) Artesian Resources (NASDAQ: ARTNA ) California Water Service Group (NYSE: CWT ) Connecticut Water Service (NASDAQ: CTWS ) Consolidated Water (NASDAQ: CWCO ) Middlesex Water (NASDAQ: MSEX ) SJW (NYSE: SJW ) York Water Company (NASDAQ: YORW ) Step 1 The first step I took to narrow down the list of possible options was to look at the earnings over the past five years of these stocks within the industry sector. I planned on removing any stocks from further review because of their negative earnings growth over the past five years; however, none of the stocks had negative earnings growth. Step 2 I then took the list of remaining stocks and checked the revenue growth of each over the past two years. I am removing any stocks that had flat revenue growth (less than 2%) or a decline in revenue over the past two years. These stocks include: American States Water Aqua America Consolidated Water Step 3 My next move was to examine the trailing PEG ratio of each of the remaining stocks. I removed any stock that had a PEG ratio over 1.5 to focus more specifically on fairly valued/undervalued stocks. These stocks included: Step 4 The next set of data I reviewed was the Fundamental and Value Scores for each of the ten remaining stocks. These scores are calculated by YCharts and I have found them to be very useful when researching investment options. More details on each of the scores can be found here and here . Fundamental Score Value Score American Water Works 5 9 Artesian Resource 8 10 California Water Service 8 10 Connecticut Water Service 8 7 SJW 9 9 York Water 8 9 To determine the best stocks for 2015, I’m only taking into consideration stocks that have values of 8 or higher for both fundamental and value scores. Doing this left me with the following remaining stocks: Artesian Resource California Water Service SJW York Water Step 5 My next step was to look at the book value of each company and to remove any stock that has seen a decrease in its book value over the past five years. However, none of the remaining stocks saw a decline in book value during this time period. Step 6 I then looked at the remaining stocks and only included stocks with earnings yields of 5% or higher in my final analysis. The only stock with a yield below this was York Water. Step 7 My next step was to look closer at each stock remaining that passed all previous criteria and determine whether or not there were any reasons to eliminate them as great stock candidates for 2015. In doing so, I reviewed the financials of each company, the most recent quarterly report transcripts, and searched for any news items that warranted concern. Artesian Resource For its last quarter , the company posted a 6% increase in revenue and an increase in earnings per share from $0.23 to $0.28 compared to the same period last year. Artesian continues to pay a high yielding (just over 4%) and slow growing (16% over the past five years) dividend and should continue to reward income investors moving forward. California Water Service For its last quarter , the company posted a 10% increase in revenue and an increase in earnings per share from a loss of $0.11 to a gain of $0.03 compared to the same period last year. The company was able to see these impressive results through a combination of rate increases, sales to new customers, and revenue decoupling mechanisms/balancing accounts. The company will be challenged by the current drought in California, but I believe that the rate case increase that was authorized will help the California Water continue to see impressive quarterly results moving forward. SJW For its last quarter , the company posted a 14% increase in revenue and an increase in earnings per share from $0.04 to $0.23 compared to the same period last year. SJW is facing the same drought issue as California Water, but rate increases and new customers have helped offset the lower customer water usage the company has seen. While the company is sure to see continued low usage rates, I feel that the company’s strong balance sheet and strategic investments will keep the company performing at a high level even during stressful times. Conclusion Out of this group of stocks, my top picks are Artesian Resource, California Water Service, and SJW. While both California Water and SJW are both dealing with a major drought, I believe that both companies have strong enough cash flow and balance sheets to continue to perform well during this time. Looking at the chart below, you can see that all three companies have performed similar so far this year, with all three of them currently down 3.99%-5.44%, while the S&P has been virtually flat. ARTNA data by YCharts When looking at long term returns, you can see that both Artesian and California Water have performed nearly identical with the market in general, while SJW has performed significantly better. ARTNA Total Return Price data by YCharts Currently, SJW is more attractively valued than both Artesian and California Water based on PE trailing ratios, while Artesian is the more attractively priced stock based on forward PE ratios and price to book value. This isn’t the only area in which all three stocks are similar. If you look at the chart below, you can see that both California Water and SJW have increase their book value more than Artesian over the past five years. ARTNA Book Value (Annual) data by YCharts But if you look at a more longer term view, you can see that Artesian has done a significantly better job of increasing book value over the long run. ARTNA Book Value (Annual) data by YCharts With all three stocks maintaining solid overall financial positions, all three stocks offering decent yields with growing dividends, and all three stocks showing fairly consistent and significant increases in revenue, I believe that these stocks are solid options for both short term and long term investors. As always, I suggest individual investors perform their own research before making any investment decisions. Disclosure: I/we have no positions in any stocks mentioned, and no plans to initiate any positions within the next 72 hours. (More…) I wrote this article myself, and it expresses my own opinions. I am not receiving compensation for it (other than from Seeking Alpha). I have no business relationship with any company whose stock is mentioned in this article.