Tag Archives: undefined

Is SCHC The Right ETF For International Exposure?

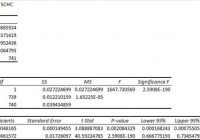
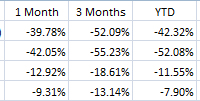
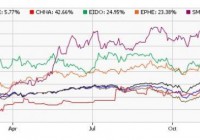
Summary I’m taking a look at SCHC as a candidate for inclusion in my ETF portfolio. The risk level is fairly acceptable for an international ETF. The ETF’s favorable risk profile is driven by the extremely diversified holdings and strong dividend yield. I’m not assessing any tax impacts. Investors should check their own situation for tax exposure. Investors should be seeking to improve their risk adjusted returns. I’m a big fan of using ETFs to achieve the risk adjusted returns relative to the portfolios that a normal investor can generate for themselves after trading costs. I’m working on building a new portfolio and I’m going to be analyzing several of the ETFs that I am considering for my personal portfolio. One of the funds that I’m considering is the Schwab International Small-Cap Equity ETF (NYSEARCA: SCHC ). I’ll be performing a substantial portion of my analysis along the lines of modern portfolio theory, so my goal is to find ways to minimize costs while achieving diversification to reduce my risk level. What does SCHC do? SCHC attempts to track the total return of FTSE Developed Small Cap ex-US Liquid Index. At least 90% of funds are invested in companies that are part of the index. SCHC falls under the category of “Foreign Small/Mid Blend”. Does SCHC provide diversification benefits to a portfolio? Each investor may hold a different portfolio, but I use (NYSEARCA: SPY ) as the basis for my analysis. I believe SPY, or another large cap U.S. fund with similar properties, represents the reasonable first step for many investors designing an ETF portfolio. Therefore, I start my diversification analysis by seeing how it works with SPY. I start with an ANOVA table: (click to enlarge) The correlation is about 69%, which is low enough to provide some solid diversification benefits so long as the ETF does not have an innately high level of risk. I measure risk with the standard deviation of daily returns. It isn’t perfect, but it works fairly well for my purposes and seems to hold up over time. Standard deviation of daily returns (dividend adjusted, measured since January 2012) The standard deviation is pretty good for foreign investments. For SCHC it is 0.8657%. For SPY, it is 0.7300% for the same period. Since SPY usually beats other ETFs in this regard, I’d look at that standard deviation level as being fairly favorable for an ETF that is competing for selection as a “Foreign Markets” ETF in my portfolio. Mixing it with SPY I also run comparison on the standard deviation of daily returns for the portfolio assuming that the portfolio is combined with the S&P 500. For research, I assume daily rebalancing because it dramatically simplifies the math. With a 50/50 weighting in a portfolio holding only SPY and SCHC, the standard deviation of daily returns across the entire portfolio is 0.7636%. Even in developed markets, I think 50% of a portfolio is way too high. When I drop the exposure to 20% in SCHC the standard deviation drops to .7342%. That’s a clear improvement, but I’d still like to see it a little lower. At 5%, the standard deviation is down to .7299% and diminishing returns are strongly in effect. Relative to other international investments, SCHC seems like a viable candidate for a larger position. I still wouldn’t consider going over 20%, but I think 5% to 10% is within reason. Why I use standard deviation of daily returns I don’t believe historical returns have predictive power for future returns, but I do believe historical values for standard deviations of returns relative to other ETFs have some predictive power on future risks and correlations. Yield & Taxes The distribution yield is 2.98%. The SEC 30 day yield is 2.11%. The ETF invests in foreign securities and I’m not a CPA or CFP. Investors concerned about tax consequences should seek advice from someone knowledgeable about their tax situation. If taxes are not a factor, the distribution yield is reasonable for producing income. Expense Ratio The ETF is posting .19% for an expense ratio. This is higher than the last few ETFs I have considered, but not high enough to stop me from considering it as a significant part of a portfolio. Market to NAV The ETF is trading right on NAV currently. However, premiums or discounts to NAV can change very quickly so investors should check prior to putting in an order. Largest Holdings The diversification within the ETF is excellent, as shown by the following chart: (click to enlarge) I don’t like including a significant position of U.S. dollars within an investment portfolio, but it is less than 2% and the portfolio of investments is phenomenally diversified. Since this ETF invests in smaller companies it is very important for the ETF to have extremely high levels of diversification. As long as the ETF trades near NAV, the ETF’s high level of diversification should continue to lead to relatively low levels of standard deviations. If there was a black swan even or investors soured heavily on international markets it could create an impact that would reach a large portion of the portfolio. Outside of those major events, the extreme diversification should help to stabilize the fund. Investing in the ETF is largely relying on modern portfolio theory. Making an investment requires a belief that markets are at least somewhat efficient so that the companies within the portfolio will be reasonably priced. Conclusion I’m currently screening a large volume of ETFs for my own portfolio. The portfolio I’m building is through Schwab, so I’m able to trade SCHC with no commissions. I have a strong preference for researching ETFs that are free to trade in my account, so most of my research will be on ETFs that fall under the “ETF OneSource” program. SCHC looks pretty good to me so far and is a leading candidate for inclusion in the portfolio.

Beware: SRF Is Likely To Cut Its 23.5% Distribution

Summary SRF has been punished by falling oil prices. The market price hasn’t fallen as much as the underlying asset value driving the CEF to trade at a 23.12% premium to NAV. SRF has an indicated distribution yield of 23.53%. This distribution is unsustainable if oil prices remain stay at current levels. Overview: Oil has fallen dramatically, pressuring the stocks of energy producers. Highly levered companies have been hit especially hard due to their risk of defaulting if energy prices don’t rebound. The Cushing Royalty & Income Fund (NYSE: SRF ) is a closed end fund that has been hit particularly hard by falling oil prices. SRF invests in energy related royalty trusts, exploration and production master limited partnerships (MLPs), and Canadian royalty trusts. Many of these investments have been hit hard by the falling oil price driving the fund’s net asset value down by 49.97% so far this year. SRF’s market price has held in a little better falling 37.21% likely supported by the fund’s large 23.53% distribution. The divergence in performance between the market price and the NAV has driven the fund to trade at a 23.12% premium. However, the large distribution and the 23% premium to NAV are likely unsustainable. Investors in the fund are likely to see a significant drop in value unless oil prices rebound dramatically. Key Investment Highlights: Premium to NAV: SRF is currently trading at a 23.12% premium to NAV. This is significantly higher than its 1 year average premium of 3.21%. Evidence of the wider than normal premium the Z-Statistic of 2.36 showing the current premium is more than 2 standard deviations wider than normal. Leveraged Exposure to Energy Prices: SRF invests in energy related royalty trusts and exploration and production MLPs. These investments are highly correlated with energy prices. Additionally, many of the holdings have taken on significant leverage to acquire drilling acreage. If energy prices remain depressed for long these investments will likely be forced to cut distributions and could face covenant violations or default. SRF itself has a leverage ratio of 20.76%. If the fund’s holdings have issues due to their high leverage ratios, SRF could also face issues with its regulatory leverage limits forcing the fund to sell assets. Unsustainable Distribution: SRF currently pays a 23.53% distribution. This distribution is unlikely to be sustained. Underlying holdings will likely have to cut their dividends due to lower energy prices which hurt their cash flow. SRF will likely need to follow suit so it wouldn’t be surprising to see a significant distribution cut from the fund. Key Investment Risks: Energy Prices: As mentioned above, SRF’s investment portfolio is highly correlated to energy prices. If energy prices rebound significantly, the underlying holdings should appreciate and the dividends may be sustainable. Company Acquisitions: It is in the downturn of market cycles that the strong players make their investments for long term growth. In this case, there is the risk that some of the oil majors my purchase smaller companies that have attractive assets. If holdings in SRF’s portfolio are purchased at premiums than it would support the share price and negate the downside case. Key Portfolio Metrics: Premium/Discount: 23.12% Z-Statistic 2.36 Market Distribution Rate: 23.53% Current Quarterly Distribution: $0.50 UNII Per Share: $0.1389 Effective Leverage: 20.76% Performance: Using ETFs with a similar investment objective can give a good comparison to evaluate management’s performance. I was unable to find ETFs that have a similar focus as SRF so I chose to look for ETFs that would give similar exposure to energy. I chose to use the iShares U.S. Oil & Gas Exploration & Productions ETF (NYSEARCA: IEO ), based on its similar focus on upstream energy production. The Energy Select Sector SPDR ETF (NYSEARCA: XLE ) is also included in the analysis to give a picture of the broader energy sector performance. SRF has significantly underperformed both ETFs during its relatively short life. The recent dramatic underperformance highlights the risk of SRF. Data as of 12/23/2014 Source: Morningstar Premium/Discount: (click to enlarge) Source: CEFConnect The fund closed 12/22/2014 at a 23.12% premium to the NAV, or underlying value of the portfolio. This is above the 52 week average premium of 3.34%. The dramatic fall in NAV over the past month may have contributed to the increase in premium as the market has not had a chance to respond to the lower value. Additionally the reported 23.53% distribution may have enticed some investors though the distribution doesn’t appear sustainable if oil prices remain low. The market price will likely adjust lower over time. A distribution cut could be a catalyst for the premium to erode. Expense Ratio: SRF pays 1.50% of weekly average managed assets to Cushing Asset Management for investment management. The annual expense ratio for AWF as of 11/30/2014 was 2.15%. This is a relatively high fee for investment management. The specialization and uniqueness of the portfolio are likely part of the high cost. However, investors have received a lot of risk without significant reward recently. Distribution: SRF pays a quarterly distribution of $0.50/share. Based on current market prices this equates to a 23.53% distribution. Nearly all of the distribution has been categorized as return of capital. Not entirely surprising due to the MLP structure of many of the fund’s investments. The distribution appears unsustainable and may need to be cut if energy prices don’t rebound significantly. Even with higher oil prices, SRF’s income received only covered 70% of its distribution after accounting for the advisory fee and operating expenses. The slide in oil prices will put additional pressure on this ratio. Leverage: SRF employs leverage gained through a margin account at Bank of America Merrill Lynch. The interest rate charged on margin borrowings is LIBOR plus 0.65%. The use of a margin account is a concern as margin could be pulled or the rate increased due to the fall in the margin collateral. Also, if interest rates were to increase, the cost of borrowing would increase putting upward pressure on an already high expense ratio. Liquidity: SRF is a small CEF with $116 million in net assets. Trading volume is thin with 73,000 shares traded on the average day. This represents $625 thousand in daily volume at current prices. This is thin liquidity for a CEF and large orders could cause wide swings in the market price. It is always wise to use limit orders to purchase or sell shares of closed-end funds, as the bid/ask spread can be wide. Management: SRF is managed by Cushing asset management, a subsidiary of Swank Capital. The management team is seasoned with managers averaging over 24 years of industry and investment experience. The management team is located in Dallas Texas close to the major players in the energy sector. Portfolio: Portfolio Allocation (click to enlarge) Source: Cushing Asset Management as of 9/30/2014 The fund is invested in upstream energy MLPs and trusts. The majority of the fund is invested in the United States with some exposure to Canadian royalty trusts. The focus on these high assets that have high distributions has increased they distribution the fund is able to pay but also comes with a significant amount of risk. The underlying value of the fund will be significantly influenced by energy prices. Top 10 Holdings Source: Cushing Asset Management as of 8/31/2014 SRF has a focused portfolio with 40 positions. The top ten holdings represent 76.2% of the total portfolio. The turnover rate has been relatively high, with 94.34% turnover in FY 2013. This concentration can be attractive when times are good, however, it increases the portfolio risk. A closer look at some of the top holdings reinforces the concern about the portfolio distribution. For example, Linn Energy, LLC (NASDAQ: LINE ) represents 9.4% of the total portfolio. LINE has an implied yield of 24.43%. However, LINE has $11 billion in long term debt vs. $4.9 billion in shareholder’s equity. If energy prices don’t rebound LINE will likely have to cut the dividend and use the cash to pay interest and repay debt. This would reduce the amount of cash available for SRF’s distribution. This is one of the starker examples in the portfolio, but many other holdings face similar issues. Strategy: SRF’s primary investment objective is to seek high total return with an emphasis on current income. Under normal conditions the fund will invest at least 80% of net assets in securities of energy related U.S. royalty trusts, Canadian royalty trusts, and exploration and production MLPs. Conclusion: The drop in energy prices has pressured SRF’s net asset value and share price. The net asset value has fallen faster than the share price driving SRF to trade at a large premium to the portfolio value. Additionally, SRF shows a 23.53% implied distribution. This distribution is likely to be cut if oil prices don’t rebound significantly. A lower distribution and a reduction in the premium price has the potential to drive the share price over 20% lower. Further, if energy prices don’t stabilize there is significant risk of additional downside. Investors should make sure they understand the risks before allocating capital to this fund.

4 Outperforming Country ETFs Of 2014

Amid a myriad of economic and political woes, the stock markets across the globe have given mixed performances. While 2014 is turning out as another banner year for the U.S. stock market with multiple record highs on several occasions, international investing has not been so encouraging. This is especially true as Vanguard FTSE All-World ex-US ETF (NYSEARCA: VEU ) targeting the international equity market has lost about 4% this year compared to a gain of 5.3% for iShares MSCI ACWI ETF (NASDAQ: ACWI ) , which targets the global stock market including the U.S. A strong dollar, Russia turmoil, slump in key emerging markets, sliding oil prices, speculation of interest rates hike faster than expected, and concerns over the global slowdown continued to weigh on the international stocks. Though developed markets started the year on a solid note, these lost momentum with Europe struggling to boost growth and inflation, and Japan suffering from the biggest setback following a sales tax increase in April that has pushed the world’s third-largest economy into a deep recession. Among developing nations, Russia has been hit hard owing to Western sanctions and a massive drop in oil prices while Greece saw another political chaos. On the other hand, India and Indonesia have shown strong resilience to the global slowdown driven by positive developments, election euphoria, new reforms and monetary easing policies. In particular, Chinese stocks have no doubt given impressive performances with the Shanghai Composite Index touching the major threshold of 3,000 for the first time in three years. The massive gains came on the back of speculation that the loose monetary policy measures will revive the dwindling economy and pump billions of dollars into the country. Additionally, growing investor confidence following prospects of a rebound in the Chinese economy, a stabilizing real estate market as well as the launch of the Shanghai-Hong Kong Stock Connect program propelled the Chinese stocks higher in recent months. There are several country ETFs that not only delivered handsome returns this year but also crushed the broad U.S. market fund. Below, we have highlighted a few of these strong momentum plays, which could be interesting picks for investors heading into the New Year. iShares MSCI India Small Cap Index Fund (BATS: SMIN ) – Up 48.3% This product provides exposure to the small cap segment of the broad Indian stock market by tracking the MSCI India Small Cap Index. Holding 180 securities in its basket, it is widely spread out across number of securities with none holding more than 2.67% of assets. Financials takes the top spot with one-fourth share followed by consumer discretionary (19.8%), industrial (18.4%) and materials (10.2%). The fund has been able to manage assets worth $24.1 million while sees light volume of about 16,000 shares per day. Expense ratio came in at 0.74%. SMIN is up over 48% this year and has a Zacks ETF Rank of 2 or ‘Buy’ rating with a High risk outlook. PowerShares China A-Share Portfolio (NYSEARCA: CHNA ) – Up 43.18% This is an actively managed ETF providing exposure to the China A-Share market using Singapore exchange FTSE China A50 Index futures contracts. The product is unpopular and illiquid with AUM of $5.3 million and average daily volume of around 8,000 shares. It charges 51 bps in fees per year from investors and has surged about 43% this year. iShares MSCI Philippines Investable Market Index (NYSEARCA: EPHE ) – Up 22.4% This product targets the Philippines stocks in the emerging Asia Pacific space and tracks the MSCI Philippines Investable Market Index. The fund has amassed $365.3 million in its asset base while trades a good volume of 236,000 shares a day. It charges 61 bps in annual fees. The fund holds a small basket of 43 firms with 61.5% of assets invested in the top 10 holdings, suggesting a high concentration risk. More than one-third of the portfolio is dominated by financials while industrials occupy the second position with 22.4% share. The fund has added over 22% this year and has a Zacks ETF Rank of 3 or ‘Hold rating with a Medium risk outlook. iShares MSCI Indonesia Investable Market Index Fund (NYSEARCA: EIDO ) – Up 20.76% This fund provides exposure to the Indonesian equity market by tracking the MSCI Indonesia Investable Market Index. Holding 102 securities in its basket, it is concentrated on both sectors and securities. The product puts about 44% in the top five holdings while financials dominates the fund’s return at 37.1%. EIDO is the most popular ETF with AUM of $578.4 million and average daily volume of nearly 665,000 shares. Expense ratio came in at 0.61%. The fund is up 20.8% so far in the year and has a Zacks ETF Rank of 2 with a High risk outlook. Bottom Line Investors should note that some specific emerging market ETFs have outperformed this year and will likely continue this trend in 2015. This is especially true, as a slump in oil price has created a major headwind for many key emerging nations or oil producing nations. Also, some developed economies are facing problems in reinvigorating growth.