Tag Archives: undefined

How To Play A Bounce In Oil. Hint: Not USO

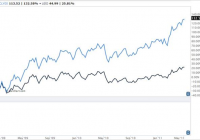
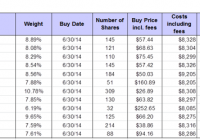
It’s the first (real) week back from holiday break, but the story is the same as it was before Christmas, and before Thanksgiving for that matter…. Crude Oil continues to fall like a lead oil filled balloon, falling below the $50 mark on Monday for the first time since 2009. It’s even gotten to the point of family and friends asking where we think Crude Oil will bottom at parties and dinners, getting our contrarian antennas perked up. The million, or actually Trillion, dollar question is where will Crude finally find a bottom and bounce back? Fortune let us know recently that the $55 drop in Brent Oil prices represents about a Trillion dollars in annual savings. Now, while some are no doubt betting on continued downside with the recent belles of the ball – the inverse oil ETFs and ETNs (the PowerShares DB Crude Oil Double Short ETN (NYSEARCA: DTO ), ProShares UltraShort Bloomberg Crude Oil ETF (NYSEARCA: SCO ) and VelocityShares 3x Inverse Crude Oil ETN (NYSEARCA: DWTI ) ), the last of which is up a smooth 527% since July {past performance is not necessarily indicative of future results}. Others are no doubt positioning for the inevitable rebound in energy prices, thinking it is just a matter of when, not if. Crude Oil is back around $70 to $100 a barrel. And what a trade that would be. Consider a move back to just $75 a barrel, the very low end of where Crude spent the last 5 years, would be a 50% return from the current $50 level. It seems like that could happen nearly overnight without anyone really thinking much about it. So how do you play a bounce in Oil? Well, the most popular play, by size and volume ( $1.2 Billion in Assets , $387 million changing hands daily), is no doubt the The United States Oil ETF, LP (NYSEARCA: USO ) . But is that really the best way to ‘play’ a bounce? Consider that USO Is designed to track the “daily” movement of oil. What’s the matter with that? One would hope that the ETF closely matches the daily move of Oil, right? Well, yes and no. Yes if you are going to buy the ETF for one day, or even a couple of days; no if your investment thesis is oil prices will climb higher over an extended period of time. Because, and here’s where it gets tricky – USO’s long term price appreciation won’t match the sum of its daily price appreciations. What? How is that possible? You see, the ETF works by buying futures contracts on Oil, and there are 12 different contracts in Crude Oil futures each year, you guessed it – one for every month. And while the so called ‘front month contract’ is trading near the number you see on the news every night ($50 yesterday), the further out contracts, such as 10 to 12 months from now, may already reflect the idea that Oil prices will be higher. Indeed, the price for the December 2015 contract is $57, versus $50 for the front month. So there’s $7, or a 14% gain, already “built in” to the futures price. What’s that mean for the ETF investor? Well, if you are correct that Oil will rebound, and it does so, to the tune of rising 14%, or $7 per barrel, over the next 11 months; the ETF likely won’t appreciate 14% as well. It likely won’t move at all, because it will have to sell out of its expiring futures positions and buy new futures positions each month. This means it will essentially have to “pay” that $7 in what’s called “roll costs.” This is why USO has drastically underperformed the “spot price” of Oil over the past five years, with USO having lost -39 % while the spot price of Oil went UP 48 %. It is like an option or insurance premium – a declining asset with all else held equal. Just look at what happened during the last big rally for energy prices between January 2009 and May 2011. That’s a 110% difference between what you thought was going to happen and what the ETF rewarded you with. (click to enlarge) (Disclaimer: Past performance is not necessarily indicative of future results) Chart Courtesy: Barchart So if you think Oil will be higher 3 months from now, or 12 months from now, instead of tomorrow, USO is at best going to give you some discounted version of your expected gain, and at worse a possible loss when Oil gains. (P.S., the ProShares Ultra Bloomberg Crude Oil ETF (NYSEARCA: UCO ) will do all this, times two… yeah) You don’t even have to take our word for it. Take the description of the USO over at ETF.com . USO is a great vehicle for riding short-term moves in expected crude prices, but longer-term holders take on heavy roll risk. Roll costs can be steep when the curve is up-sloping. Ok – so don’t offer a problem without a solution… What other options are out there? Well, in our realm of futures based investments, you could: Trade futures in Crude Oil, Heating Oil, RBOB Gasoline that match your time frame for a rise in prices; rolling them once annually if needed, as we’ve recommended instead of commodity ETFs for some time now. For example, if you think Crude Oil will be higher 12 to 18 months from now, buy the June 2016 Crude Oil futures (currently It will still underperform the pure spot price, but will only pay that roll cost once per year instead of multiple times). Invest with an energy focused professional commodity trading advisor, we have some names. Invest with a trend following manager – who should benefit from a long term trend up (just as they are benefiting from the trend down right now {past performance is not necessarily indicative of future results}, albeit the energy portion would only be a small portion (

Risks And Avoidable Mistakes For 2015

Originally published on Jan. 4, 2015 Introduction For most dollar oriented investors 2014 was an “okay” year with a third year in a row of double digit gains for the S&P 500, but not for the bulk of institutional accounts. Consciously or not, many investors and managers were aware of the length of the present bull market having entered its 61st month. This has created twin dilemmas for the prudent management of responsible money. First dilemma – Large Cap over-ownership As regular readers of these posts recognize and true to my analytical history, I tend to view investments through the lens of mutual funds. When simplifying the fund performance data for 2014 by size of market capitalizations the following is revealed: Large Cap funds 11% Multi-cap funds (Unrestricted/ or “go anywhere” funds 9% Mid Cap funds 8% Small Cap funds 3% In a dynamic economy the rank order of operating earnings power generation would be in the opposite order, being led by Small Caps or possibly the successful “Go Anywhere” funds. Focusing on operational earnings, excluding foreign exchange benefits, I believe that the Large Caps were producing approximately 3 times the long-term growth of the Small Caps. The better market performance of the Large Caps, I believe, was a function of market structure changes. Some institutional investors being concerned with the duration of this bull market moved heavily into Large Cap stocks directly or more importantly through the use of ETFs invested in the S&P 500 and other indices. Because of perceived greater liquidity in Large Caps they were hiding out in what we used to call warehouses. With governments all over the world looking to Large Caps being “social progress” engines, I have some doubts as to the growth prospects for Large Cap companies. Second dilemma – Historical constraints As is often the case, apparent boundaries come with both hard data and locked-in thought processes. The data is the easy part. While as noted we are in the sixty-first month of the recovery, of the nine last market recoveries, four have been over 100 days in length with the longest being 181 days. Thus for a manager a possible career risk is exiting too soon which puts a premium on investing in liquid positions. Because so many others have made similar judgments as to the better liquidity in Large Caps, if there is a sudden drop in the market, I believe the excessive amount invested in Large Caps will find their exit liquidity either expensive or non-existent for those that are late. The biggest risk for investors and their managers are the biases that many of us labor with in making so-called rational decisions. The following are a list of these biases as listed by Essential Analytics. List of biases Outcome, herding, conviction (the curse of knowledge), recency, framing, band wagon effect, information, anchoring, optimism. I suggest that many of these biases find their way into reports; supporting in effect, the reasons we all have made decisions that haven’t worked out. The key for all of us is to understand our biases. Some biases we will be able to overcome. Others we will have to accept as immutable. This suggests that when putting together a portfolio of funds or managers, it would be wise to try to diversify the various biases of the hired portfolio managers as well as our own as the owners or fiduciaries of the capital being deployed. Overcoming biases I have a definite advantage in this task by personality. By nature I am both curious of what I don’t know and often a contrarian. As a contrarian again using the mutual fund microscope, the following may be useful thoughts: Looking to extremes one might wish to set up a pair trade of being long some of the components in the S&P Latin American energy index which declined -39% vs. the average Indian fund which was up 41% in 2014. In a similar fashion one might start to research funds in the following groups that declined in 2014: Energy Commodity funds -34% General Commodity funds -16% Global Natural Resources funds -15% Domestic Natural Resources funds -15% Dedicated Short-bias funds -15% I take some comfort in the contrarian thoughts contained in the headline to John Authers insightful Financial Times column: “The case for gently shifting money away from US.” I believe a well-reasoned portfolio should be looking for opportunities on a global basis both in terms of what companies do and where various securities are traded. Final thought Many year-end predictions are essentially extrapolations of existing market trends and this could be what will happen. However, I am searching for the beginnings of new trends that will produce +20% or -20% in a twelve month period. I would appreciate hearing your thoughts as to when and which direction (or both) you expect price movement. I firmly believe we will once again experience this kind of action.

Minimum Volatility Stocks: Out-Of-Sample Performance Of USMV Buy & Hold Models

Originally published on Dec. 16, 2014 The backtest reported in this article showed that ranking the holdings of USMV , the iShares MSCI USA Minimum Volatility ETF, and selecting a portfolio of the 12 top ranked stocks, provided higher returns for the buy & hold portfolio than for the underlying ETF. To test these findings out-of-sample we launched the Best12[USMV]-July-2014on Jun-30-2014 and the first sister model Best12[USMV]-Oct-2014 on Sep-29-2014. Holdings and performance have been published weekly on our website since then. So far to Dec-15-2014 these portfolios have gained 19.2% (6.8%) and 10.5% (5.3%), respectively. (USMV gains are in brackets.) The test will be expanded by the launch on Jan-5-2015 of the second of the three sister models quarterly displaced, the Best12[USMV]-Jan-2015, which again will consist of the 12 highest ranked stocks of the then point-in-time holdings of USMV. Eventually there will be four quarterly displaced Best12[USMV] models at iMarketSignals to check whether the out-of-sample [OOS] performances of the models exceed those of USMV over the same periods. Only when the OOS periods are long enough can one decide whether this is a profitable investment strategy. One can probably assume this to be the case if by the end of next year the combined returns of the models are indeed significantly higher than the combined returns of USMV for the corresponding periods. Although the performance of the two models have been considerably better than that of USMV, one should not commit capital in the expectation that strategies that worked well in-sample, and for a few months OOS, are therefore also bound to do well in the future. Backtest Parameters It is relatively simple to “overfit” an investment strategy so that it performs well in-sample, but the more complex a model is, the higher the likelihood of the OOS performance to underperform the backtest’s results. Therefore a simple algorithm with only a few parameters was chosen, with buy- and sell rules kept to a minimum, details of which were provided in the original article. The model should also be tax-efficient because the holding period for each stock will normally be at least one year long. Current Holdings and Return to Dec-15-2014 for Best12[USMV]-July-2014 Of the portfolio’s initial holdings of 12 stocks, 11 of them gained value since inception on Jun-30-14, with the portfolio showing a 19.23% return to Dec-15, while iShares’ USMV gained 6.77% over the same period. A starting capital of $100,000 at inception grew to $119,230, with fees and slippage accounted for. Table 1 below shows the current holdings, unchanged since inception, and return for each position. (click to enlarge) (click to enlarge) The performance graphs of $100 invested in the Best12[USMV] and SPY (the ETF tracking the S&P500), is shown below, with the red graph indicating the value of Best12[USMV]-July-2014 and the blue graph depicting the value of SPY. (click to enlarge) (click to enlarge) Current Holdings and Return to Dec-15-2014 for Best12[USMV]-Oct-2014 Of the portfolio’s initial holdings of 12 stocks, 11 of them gained value since inception on Sep-29-14, with the portfolio showing a 10.53% return to Dec-15, while iShares’ USMV gained 5.30% over the same period. A starting capital of $100,000 at inception grew to $110,530, with fees and slippage accounted for. Table 2 below shows the current holdings, unchanged since inception, and return for each position. (click to enlarge) (click to enlarge) The performance graphs of $100 invested in the Best12[USMV] and SPY (the ETF tracking the S&P500), is shown below, with the red graph indicating the value of Best12[USMV]-July-2014 and the blue graph depicting the value of SPY. (click to enlarge) (click to enlarge) Following the Models At our website, the weekly performance update could be followed already from July 2014 onward. It was originally predicted that a 12-stock model should outperform USMV, which the results of the July and October models so far confirm. (The weekly updates can also be viewed by non-subscribers to iM in the archive section, delayed by a few weeks.) To track performance over an extended OOS period we will be adding, additional to the Jul-2014 and Oct-2014 models, another two similar models, the Jan-2015 and Apr-2015 models. At inception each model will have a 12-stock portfolio selected from the point-in-time holdings of USMV. The universe from which stocks are selected will be updated every three months for each model with the universe corresponding to the then current holdings of USMV. Current holdings of the models, which may not be included in the new universe, will be added to the universe. This will ensure that stocks are not sold because they may be omitted from future holdings of USMV, and the models can keep their holdings for at least one year as stipulated by the sell rules. It is expected that by April 2015 the combined stock holdings of the four models will be about 20% of the holdings of USMV, about 30 different stocks. The portfolio is expected to show better returns than USMV, provided that the OOS performance continuous to confirm the backtest’s results. Appendix Combined Holdings The combined models hold 18 different stocks of which 6 are represented in both models as shown in the table below. Combined Holdings of Best12(NYSEARCA: USMV )-July and Best12( USMV )-Oct Ticker Nr. of times in combination Sector AZO 1 Consumer Discretionary BBBY 1 Consumer Discretionary DG 2 Consumer Discretionary DLTR 1 Consumer Discretionary ROST 1 Consumer Discretionary CVS 1 Consumer Staples PRE 1 Financials TRV 1 Financials Y 1 Financials CAH 2 Health Care ESRX 1 Health Care MDT 1 Health Care LMT 1 Industrials LUV 2 Industrials MMM 1 Industrials PCP 2 Industrials EBAY 2 Information Technology SNPS 2 Information Technology