Why Investors Should Not Party Like It’s 1999
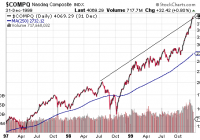
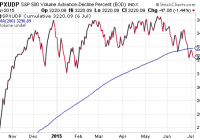
In 1999, it was the dot-com revolution that caused investors to ignore the exorbitant valuations and pitiful breadth. In 2015, it is the remarkably low cost of capital as provided by central banks worldwide that is causing investors to dismiss ridiculous valuations and dismal market internals. Stocks are super expensive today, much like they were in 1999. Yet are the stock market internals (breadth) genuinely as weak as they were back in 1999? No, they are not. The take home? Employ a tactical asset allocation strategy and stick with it. Tens of thousands of investors read my commentary at popular financial portals. Some have been reading my articles for more than a decade. Others might have clicked on a social media “follow” link in the last month or the last last year. Ironically, few realize that I originally developed a front-n-center persona on national talk radio in the late 1990s. The medium was unique in the way that listeners felt like they had a connection with me (a.k.a. “the G-Man”) and I felt connected to them. In fact, I felt a responsibility to help people understand investment mania as well as how to protect one’s self from devastating loss. Scores of folks in 50 some-odd cities may have listened for entertainment and perspective. On the other hand, many of those individuals did not take my words to heart. For instance, in 1999, I compared the stocks on the New York Stock Exchange (NYSE) with those that traded on the NASDAQ. The NYSE Composite had been flattening out over the final year-and-a-half of the 1990s whereas the NASDAQ Composite appeared to be charting a near-vertical course northward. Not only that, the records for the NASDAQ had been occurring on sky-high valuations and declining NASDAQ market internals (breadth). The bleak combination warranted caution. I did not tell investors over the radio airwaves to sell every equity holding. After all, the NASDAQ’s uptrend remained intact due to a handful of market-cap leaders still shouldering the work-load. Instead, I suggested tactical asset allocation shifts to prepare for the inevitable bearish turn somewhere down the pathway. Lighten up on the more aggressive holdings that had already experienced the greatest gains. Shift a bit to value. Raise cash equivalents for future buying opportunities. And pick up a bit more of investment grade bonds. The generalized recommendation to reduce the risk of loss was a winner in practice. Many who had lost 50%, 60%, 70% of their net worth pleaded for specialized asset management. Indeed, the 2000-2002 tech wreck is the reason that I was able to start my own Registered Investment Adviser that focused on the growth and protection of retirement portfolios. Flash forward to present day euphoria. The collective sentiment of the go-for-growth crowd is that central banks will never allow recessionary pressures to build; relatively low rates and/or the possibility of additional measures to create money electronically will be there to prop up equities should the economy or market confidence stumble. In 1999, it was the dot-com revolution that caused investors to ignore the exorbitant valuations and pitiful breadth. In 2015, it is the remarkably low cost of capital as provided by central banks worldwide that is causing investors to dismiss ridiculous valuations and dismal market internals. Are valuations really that ridiculous right now? Undoubtedly. And it does not matter if you prefer cyclically-adjusted price ratios (e.g., PE10), current price ratios (e.g., price-to-sales), the Buffett Indicator (market-cap-to-GDP) or a dividend yield-earnings yield combo. One can only decide that, like 1999, valuations no longer matter in a “New Economy,” or that 10-year returns for buy-n-hold will be woeful. In contrast, one could raise cash and less risky assets in his/her portfolio to buy at lower prices than currently exist. “Okay, Gary,” you concur. Stocks are super expensive today, much like they were in 1999. Yet are the stock market internals (breadth) genuinely as weak as they were back in 1999? No, they are not. That said, stock market breadth is noticeably shaky and growing shakier by the moment. Take a look at the ability of today’s NASDAQ to keep powering forward in price, albeit at a slightly slower pace, even as declining issues have started to overwhelm advancing issues. The similarity to the late 1990s is discernible. The take home? Employ a tactical asset allocation strategy and stick with it. By adjusting your portfolio’s mix when more caution is warranted, you will improve your risk-adjusted returns over time. For instance, when sky-high valuations couple with weak market internals, a 65% growth/35% income investor might downshift to 50% large-cap equity/30% investment-grade income/20% cash. Another person might be more risk averse, and decide that 40% large-cap equity/25% investment-grade income/35% cash places him/her in a better position to weather a future storm. Naturally, there is a flip side here. When low-to-fairly valued prices couple with improving market internals, a tactical asset allocation strategy would call for more risk. It would be time for the moderate investor described above to rebalance back to his preferred level of 65% growth/35% income. Moreover, the growth would likely include smaller-caps as well as higher-yielding income on the other side of the ledger. I recognize that not everyone wishes to engage a tactical asset allocation strategy. Fair enough. Still, those who paid attention when I addressed valuation and breadth concerns to a national audience in 1999 did not meet with disaster in 2000-2002; those who read my articles and recession warnings in 2008 did not experience the level of devastation that many experienced in the 2008-2009 financial collapse. Similarly, to the extent that you may experience apprehension about setting your portfolio on cruise control – to the extent that you wonder about the sense of holding onto the most aggressive securities in your accounts forever and ever – consider your alternatives. Perhaps hold onto assets like the iShares S&P 100 ETF (NYSEARCA: OEF ) , the Health Care Select Sect SPDR ETF (NYSEARCA: XLV ) and the iShares MSCI USA Minimum Volatility ETF (NYSEARCA: USMV ) ; perhaps let funds like the iShares Russell 2000 ETF (NYSEARCA: IWM ) go until the time that we have more attractive valuations and improving market internals (breadth). Disclosure: Gary Gordon, MS, CFP is the president of Pacific Park Financial, Inc., a Registered Investment Adviser with the SEC. Gary Gordon, Pacific Park Financial, Inc, and/or its clients may hold positions in the ETFs, mutual funds, and/or any investment asset mentioned above. The commentary does not constitute individualized investment advice. The opinions offered herein are not personalized recommendations to buy, sell or hold securities. At times, issuers of exchange-traded products compensate Pacific Park Financial, Inc. or its subsidiaries for advertising at the ETF Expert web site. ETF Expert content is created independently of any advertising relationships.