Tag Archives: undefined

Why Long-Term Investor Over Short-Term

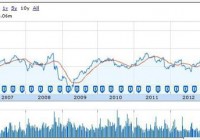
Long-term investing is delayed gratification, whilst short-term is income-orientated. The stock market has averaged 9% per year over the long term. Vanguard has a suitable ETF for long-term passive investors. Bearish signs on the S&P 500 and Gold in the short term, but Gold in the long term looks attractive from here. This is an important question to ask yourself before you invest capital into the markets. “Start with the end in mind” is a good question to ponder over your investment goals. Do you want to be active or passive? Do you want regular income or are you going to leave your money to compound over time? What about day trading? The answer to these questions is going to be different for everyone but they are definitely questions you should ask yourself before you start investing. Let’s discuss some long- and short-term set-ups at present so you can have a better idea on the strategy that suits your personality the best. So what’s your end goal here if you want a career in investing? Well there are 2 extremes. You can learn to become a compounding long-term giant like Warren Buffett or a day trader or even a high-frequency trader where your sole objective is daily income. Long-term investors do their due diligence on multiple companies, and usually hold onto their underlyings for at least 6 to 12 months, if not years, before thinking of liquidating. Day traders and short-term investors, on the other hand, mainly look at charts, moving averages, volatility and sentiment in order to predict short-term direction. Long-term investing brings many advantages. You are not glued to your screen everyday watching for every uptick. Professional investors’ “modus operandi” is to thoroughly research companies and then make their decisions accordingly. This is where the big gains are because you are effectively an insider. You know information about startups that the public doesn’t. If you want to be in this game full time (this being your career), I believe that is the end goal. Nevertheless, not everyone has that sort of time when starting out, so let’s take a look at the steps you could take to get to your end goal faster. Most investors are definitely passive, as there are constraints on their time. This is definitely the best way to start out. There are many vehicles such as (NYSEARCA: VTI ) that average between 8% and 9% before tax annually over the long term. It is very difficult to beat the market when starting out, so this is a good strategy for an investor starting out on their career. Compounding works over time in your favor, and if you start out with a sizeable balance and also add to it regularly, it can turn into a sizeable amount of capital after some time. Every “saver” should adopt this approach as it is extremely difficult to get rich on savings alone. In our 1% portfolio, we have many equities that we will not sell at a loss because we are adopting the above principle. Our chosen equities will at least match the returns mentioned above. Many investors talk about the 2008 crash and how equities lost 50% of their values. However, many quality blue chips recovered and now have much higher prices than 2007. Let’s take a look at 2 of our holdings in our portfolio, Kellogg (NYSE: K ) and Coca-Cola (NYSE: KO ). We are not putting stop losses on these underlyings. Take a look at charts below to see their action over the last 10 years. (click to enlarge) (click to enlarge) As you can see, both companies recovered after the 2008 crash and for good reason. Both companies are leaders in their industries and cash rich. Even when stocks were plummeting in 2008, these companies raised their dividends. Kellogg has now raised its dividend for 10 straight years, and Coca-Cola has done the same for 52 years straight! Both are now yielding just under 3% for shareholders, but the yield was far higher in 2008 as dividends and stock prices converged. These stocks should definitely at least match the stock market going forward. This is why we will never sell them at a loss, as we know they will recover over time . These types of stocks give you a buffer (support) through good fundamentals and increased dividends. Let’s look at Gold also over a 10-year period. Gold has definitely been in a bull run since 2000. Have a look at the chart below of (NYSEARCA: GLD ) (ETF that tracks the price of Gold) to confirm. (click to enlarge) The startling fact is that amidst all the doom and gloom surrounding Gold recently, the precious metal is still up almost 180% over the last 10 years, which beats the stock market by double. With all the easing measures that central banks are adopting at present, Gold should rise from here if the bankers can’t halt deflation in its tracks, so I see no reason for selling Gold now, assuming you are a long-term investor. Nevertheless, let’s now look at short-term outlooks for both the stock market and Gold. Obviously, if the stock market corrects, our selected underlyings will also correct and definitely the stock market is more overbought now than Gold (period of 3 to 5 years). Look at the chart of (NYSEARCA: SPY ) below. As you can see, the S&P has run through its 50-day moving average, but more importantly, the trend line from the October lows last year to the December and January lows have been broken. This should imply downward action in the stock market for the next month or so but the slide may be halted by the upcoming FOMC meeting, which takes place on the 29th of this month. These meetings have acted as support for the market in the past, so I wouldn’t be surprised if the meeting puts a temporary floor under the market yet again later this month. (click to enlarge) Gold in the short term doesn’t look that attractive either. The volume in (NYSEARCA: DUST ) has spiked (see chart). This is an inverse leveraged ETF (x3 in the mining sector), and usually gives good predictions about where the mining sector is going in the short term. (click to enlarge) Also, when you look at the chart of (NYSEARCA: GDX ), you see that the mining ETF has printed a bearish candle in the last few days and the RSI levels are rather high. (click to enlarge) So how do you want to invest?. Do you want to hold through the down moves or sell? (passive or active). You need to answer this question before you start investing. Neither one is right nor wrong but one thing is clear. If Gold goes to the stratosphere, the long-term Gold bulls who own low-cost ETFs or physical will do very well. They have less trading costs, less headaches about short-term movement in price and obviously more compounding of their capital. If you decide you want to be a short-term or swing trader, be willing to invest the time because you will really have to sharpen your technical skills before being able to beat passive investors, but it most certainly is possible. Also nobody talks about the time involved when trading short-term. Passive investors are using that time to make money in other areas or researching other companies. What’s that time worth to passive investors, another 2%, 3%, 5% annually? These are only questions you can answer… Personally, I like to combine both but I always try to veer towards being long-term and fundamentals. Invariably, this means that the income from my short-term investments varies a lot every month, as I give precedence to my long-term goals.

An ETF For European QE

Summary European QE appears likely at the next meeting. In order to overcome German opposition, the QE program may favor northern European bonds and stocks more than anticipated. The bear market in the euro will continue in the wake of QE. Back in December, ECB President Mario Draghi said consensus wasn’t needed for a QE program. The stumbling block in Europe has been several hard money nations led by Germany . These are the countries often lumped together as part of a northern euro block, such as Holland, Austria and Finland, who prefer a strong euro to a weak one. On the other side are the Greeks, Italians, Spanish and French who would do better with a weaker euro. Global investors are giving the south of Europe its wish by selling the euro, but a QE program would be a big help to nations struggling with unsustainable sovereign debts. If a QE program is launched, it will be good news for European equities, and due to the need to overcome German-led opposition, may benefit the north much more than expected. Will There Be European QE? The impetus for a QE policy in Europe is the persistently low inflation on the continent. Falling oil prices knocked consumer inflation below zero in December, which is generally a good thing for the economy, but in the bizarro world of heavily indebted nations, is a scary prospect. Since debt continues to pile up, a rise in purchasing power means the outstanding debt grows in real terms even with no new borrowing. With even the efficient German economy looking at 1 percent GDP growth in 2015, there is a desire for higher inflation and higher nominal growth rates in Europe. To satisfy the demand, the ECB may try an asset purchase program and it has room to expand its balance sheet : … the central bank can still ease policy by expanding the size of its own balance-sheet, which it intends returning to the high of €3 trillion ($3.7 trillion) that it reached in early 2012. That amounts to an extra €1 trillion, though no date has been specified for accomplishing the increase. The previous peak occurred as the ECB averted a funding crisis for banks by providing them with €1 trillion in three-year loans in the winter of 2011-12. Since then its balance-sheet has been waning as banks in northern Europe repaid the money early. One issue the ECB faces is that there is no “European” bond. In order to do QE, it must buy the bonds of member states, but how does it do this fairly? One rumored method is to use the national central bank’s contributions to the ECB, which would mean German bonds would receive the biggest dose of QE money (though not necessarily the biggest dose relative to GDP or outstanding debt). German bonds are already expensive. The yield on 10-year German bonds is below 0.5 percent in part due to low inflation, but also due to investors worried about a breakup in the euro and attracted to northern Europe’s ability to repay its debts. Were the eurozone to break apart, the northern European currencies (or a northern euro) would appreciate in value, while the southern European currencies (or southern euro) would depreciate in value. The German bonds could also be trading down on the anticipation of European quantitative easing. Whatever the reason, investors clearly favor the north over the south and they do so even with rumored QE on the way. As German bond yields fall faster than southern European bond yields, it raises the question of where QE money will go. If the bonds aren’t falling as a result of fears of a possible breakup or Grexit, and QE money is doled out based on contributions, it could mean the bulk of QE money will not make it to southern Europe and instead flow into the assets preferred by investors holding German bonds. Southern Europe will benefit from QE, but the biggest winners might be northern European equity and bond markets. An Important Week For the European Markets The ECB meets on January 22 and three days later, the Greeks vote. Whatever happens, one of the least likely outcomes is business as usual: no QE and a win for the Greek political establishment. A QE policy would smooth financial market concerns ahead of a Greek vote (if they think it helps Syriza, will they delay QE?), and if QE is initiated, it is likely to favor the nations that need it least. The unpredictable Greek election is a major short-term risk for the euro. Although Syriza has maintained a small lead in the polls, the follow on results are unpredictable because party leader Alexis Tsipras’ rhetoric may not match his actions, and the response of the troika is unknown. Adding to the lack of clarity, German officials leaked their opinion that a Greek exit from the euro isn’t the end of the world. ETF Strategy After breaking below the 2010 lows set at the depths of the first Greek sovereign debt crisis, the euro is in a clear bear market with parity looming in the not too distant future. QE or no QE, fundamentals are moving in favor of the dollar and against the euro, with faster GDP growth and higher interest rates as two of the main positives for the greenback. One way to bet against a weak euro is via ETFs such as the PowerShares DB USD Bull ETF (NYSEARCA: UUP ) or the ProShares UltraShort Euro ETF (NYSEARCA: EUO ). While the announcement of a European QE program may be short-term bullish for the euro because traders may “buy the news,” equities have been weak due to the looming Greek election. A QE policy would be net positive for equities because it would increase confidence in the market. While it could lag in the short-term from a euro bounce, the WisdomTree Europe Hedged Equity ETF (NYSEARCA: HEDJ ) is the best option for a bull market in European stocks and a bear market in the euro. Index & Strategy HEDJ has tracked the WisdomTree Europe Hedged Equity Index since August 29, 2012. The main attraction of HEDJ is the currency hedge. An investor in HEDJ receives only the nominal change in the euro denominated value of the stocks. This doesn’t eliminate currency risk; it shifts it. When the euro is weak, HEDJ will beat an unhedged European equity fund, but when the euro is strong, HEDJ will under perform an unhedged European equity fund. The index takes the currency approach a step further though. Here’s an important part of the index description : The Index is based on dividend paying companies in the WisdomTree DEFA Index that are domiciled in Europe and are traded in Euros, have at least $1 billion market capitalization, and derive at least 50% of their revenue in the latest fiscal year from countries outside of Europe . Not only does HEDJ hedge away euro risk, it also holds stocks in companies most likely to benefit from a weaker euro because they export or have extensive multinational operations. We can see how this changes the portfolio by comparing HEDJ to an unhedged eurozone fund, the i Shares MSCI EMU ETF (NYSEARCA: EZU ). Here’s the country exposure for each fund, based on data from the fund providers’ websites as of January 12. The EZU numbers do not add to 100 percent because EZU lists “Other” at 1.30 percent of assets. Both ETFs have heavy exposure in the larger economies of France and Germany, but HEDJ is more balanced in its approach. Sector exposure is another story. HEDJ has about 12 percentage points less in financial than EZU. Financials are more closely tied to the domestic economy and some fall afoul of HEDJ’s rule for owning companies with non-European sourced revenue. That rule also causes the fund to be underweight utilities and energy relative to EZU. HEDJ is overweight the consumer staples, industrial and consumer discretionary sectors, which are represented in the portfolio by major multinational firms such as Anheuser-Busch InBev (NYSE: BUD ), Unilever (NYSE: UL ) and L’Oreal ( OTCPK:LRLCY ). Although financials may be among the beneficiaries of a QE program, HEDJ’s exposure to multinationals is attractive because Europe’s economic prospects aren’t great. Even with QE, the eurozone will be lucky to generate low inflation and growth. The story here is that equity valuations will rise due to liquidity added to the market and increased confidence generated by the central bank’s actions. Unlike the U.S., a breakup of the currency union is a low probability, but high cost event that weighs on European equities whenever fear of a potential breakup spikes. Performance This first chart is a price ratio of HEDJ to EZU. A rising line shows the outperformance of HEDJ. The black line is the EUR/USD exchange rate. This shows changes in the exchange rate, explain the direction of relative performance. HEDJ leads when the euro falls. (click to enlarge) The return chart below shows that the different sector exposure has caused total returns to fluctuate more than by the exchange rate. Since inception as the Europe hedged fund in August 2012 through January 12, HEDJ is beating EZU by more than 10 percent, but the euro is down less than 6 percent over this period. Back in May 2014, EZU was beating HEDJ by about 17 percent since inception, but the euro was only up 10 percent. This behavior is consistent with HEDJ’s index rule on non-European revenues. (click to enlarge) Expenses HEDJ charges 0.58 percent versus 0.48 percent for EZU, a small increase for adding the currency hedging. Risk & Reward This decision tree shows which exposure makes the most sense for different currency and equity situations. Active investors bullish on European equities and bearish on the euro should opt for a fund such as HEDJ. Those investors also bullish on the euro should stick with an unhedged ETF such as EZU. For investors bearish on stocks, but bullish on the euro, holding a currency fund such as the CurrencyShares Euro Trust ETF (NYSEARCA: FXE ) or a bond fund holding euro-denominated bonds is the best option. For those bearish on both stocks and the euro, holding a currency short fund such as EUO is an option, but for many investors, simply avoiding Europe altogether is the best option. (click to enlarge) Conclusion A European QE program will be bullish for European equities, but equities face a major risk from the Greek election. Odds are Europe will choose the easier path of accommodating a political shift in Greece, but there’s a small chance that either Greece or the troika scuttle the bailout agreements. Assuming the extreme path is avoided though, confidence will recover once the Greek election is over and a QE program will further increase it. Meanwhile, QE will be bearish for the euro over the intermediate to long-term. HEDJ is perfectly situated to benefit in an environment of a weak euro and rising European equities.

Financial ETF: XLF No. 5 Select Sector SPDR In 2014

Summary The Financial exchange-traded fund finished fifth by return among the nine Select Sector SPDRs in 2014. Along the way, the ETF had its roughest month of the year in January, when it dipped -3.63 percent. Seasonality analysis indicates the fund could have a tough first quarter. The Financial Select Sector SPDR ETF (NYSEARCA: XLF ) in 2014 ranked No. 5 by return among the Select Sector SPDRs that divide the S&P 500 into nine portions. On an adjusted closing daily share-price basis, XLF blossomed to $24.73 from $21.49, a burgeoning of $3.24, or 15.08 percent. As a result, it behaved better than its parent proxy SPDR S&P 500 Trust ETF (NYSEARCA: SPY ) by 1.61 percentage points and worse than its sibling Utilities Select Sector SPDR ETF (NYSEARCA: XLU ) by -13.66 points. (XLF closed at $23.92 Monday.) XLF also ranked No. 5 among the sector SPDRs in the fourth quarter, when it led SPY by 2.39 percentage points and lagged XLU by -5.89 points. And XLF ranked No. 2 among the sector SPDRs in December, when it performed better than SPY by 2.11 percentage points and worse than XLU by -1.72 points. Figure 1: XLF Monthly Change, 2014 Vs. 1999-2013 Mean (click to enlarge) Source: This J.J.’s Risky Business chart is based on analyses of adjusted closing monthly share prices at Yahoo Finance . XLF behaved a lot better in 2014 than it did during its initial 15 full years of existence based on the monthly means calculated by employing data associated with that historical time frame (Figure 1). The same data set shows the average year’s weakest quarter was the third, with a relatively small negative return, and its strongest quarter was the fourth, with an absolutely large positive return. Generally consistent with this pattern, the ETF had a huge gain in the fourth quarter last year. Figure 2: XLF Monthly Change, 2014 Versus 1999-2013 Median (click to enlarge) Source: This J.J.’s Risky Business chart is based on analyses of adjusted closing monthly share prices at Yahoo Finance. XLF also performed a lot better in 2014 than it did during its initial 15 full years of existence based on the monthly medians calculated by using data associated with that historical time frame (Figure 2). The same data set shows the average year’s weakest quarter was the first, with a relatively small positive return, and its strongest quarter was the fourth, with an absolutely large positive return. Clearly, this means there is no historical statistical tendency for the ETF to explode in Q1. Figure 3: XLF’s Top 10 Holdings and P/E-G Ratios, Jan. 9 (click to enlarge) Notes: 1. “NA” means “Not Available.” 2. The XLF holding-weight-by-percentage scale is on the left (green), and the company price/earnings-to-growth ratio scale is on the right (red). Source: This J.J.’s Risky Business chart is based on data at the XLF microsite and FinViz.com (both current as of Jan. 9). Three massive equity-market bubbles are associated with the 21st century. The technology sector was ground zero when the first one burst, and the financial sector was ground zero when the second one burst. In the former case, the Technology Select Sector SPDR ETF ( XLK ) had double-digit percentage losses in each of three consecutive years (2000-2002). In the latter case, XLF had double-digit percentage losses in each of two straight years (2007-2008). It plunged by more than one-half in 2008 alone, which means the ETF is distinguished by delivering the worst annual performance by any of the sector SPDRs since their launch in December 1998. With the third massive stock-market bubble associated with the 21st century apparently in the early stage of its own bursting, I anticipate XLF will continue to be a middle-of-the-pack performer among the sector SPDRs, with the biggest risk to this expectation in the short term being the Federal Open Market Committee announcement April 29. On the one hand, the valuations of XLF’s top 10 holdings appear unlikely to function as tailwinds for the ETF’s price appreciation in the foreseeable future (Figure 3). On the other hand, numbers on the S&P 500 financial sector reported by S&P Senior Index Analyst Howard Silverblatt Dec. 31 suggested it is not all that overvalued, with its P/E-G ratio at 1.31. Disclaimer: The opinions expressed herein by the author do not constitute an investment recommendation, and they are unsuitable for employment in the making of investment decisions. The opinions expressed herein address only certain aspects of potential investment in any securities and cannot substitute for comprehensive investment analysis. The opinions expressed herein are based on an incomplete set of information, illustrative in nature, and limited in scope. In addition, the opinions expressed herein reflect the author’s best judgment as of the date of publication, and they are subject to change without notice.