Scalper1 News
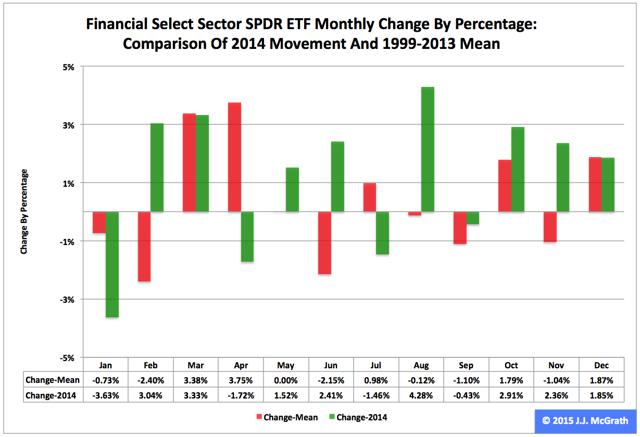
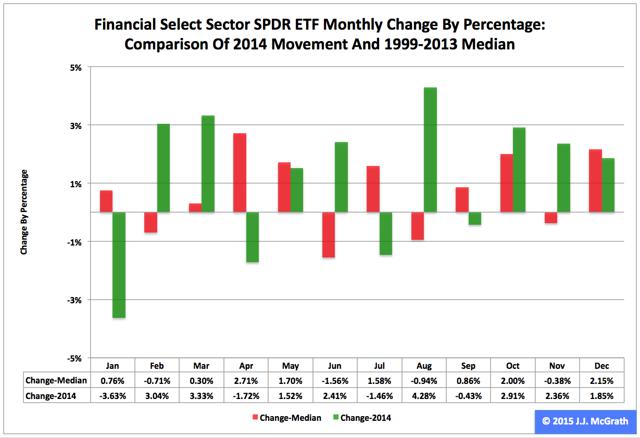
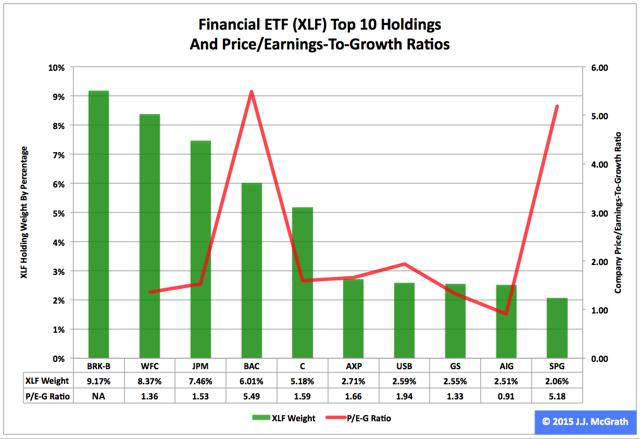 Summary The Financial exchange-traded fund finished fifth by return among the nine Select Sector SPDRs in 2014. Along the way, the ETF had its roughest month of the year in January, when it dipped -3.63 percent. Seasonality analysis indicates the fund could have a tough first quarter. The Financial Select Sector SPDR ETF (NYSEARCA: XLF ) in 2014 ranked No. 5 by return among the Select Sector SPDRs that divide the S&P 500 into nine portions. On an adjusted closing daily share-price basis, XLF blossomed to $24.73 from $21.49, a burgeoning of $3.24, or 15.08 percent. As a result, it behaved better than its parent proxy SPDR S&P 500 Trust ETF (NYSEARCA: SPY ) by 1.61 percentage points and worse than its sibling Utilities Select Sector SPDR ETF (NYSEARCA: XLU ) by -13.66 points. (XLF closed at $23.92 Monday.) XLF also ranked No. 5 among the sector SPDRs in the fourth quarter, when it led SPY by 2.39 percentage points and lagged XLU by -5.89 points. And XLF ranked No. 2 among the sector SPDRs in December, when it performed better than SPY by 2.11 percentage points and worse than XLU by -1.72 points. Figure 1: XLF Monthly Change, 2014 Vs. 1999-2013 Mean (click to enlarge) Source: This J.J.’s Risky Business chart is based on analyses of adjusted closing monthly share prices at Yahoo Finance . XLF behaved a lot better in 2014 than it did during its initial 15 full years of existence based on the monthly means calculated by employing data associated with that historical time frame (Figure 1). The same data set shows the average year’s weakest quarter was the third, with a relatively small negative return, and its strongest quarter was the fourth, with an absolutely large positive return. Generally consistent with this pattern, the ETF had a huge gain in the fourth quarter last year. Figure 2: XLF Monthly Change, 2014 Versus 1999-2013 Median (click to enlarge) Source: This J.J.’s Risky Business chart is based on analyses of adjusted closing monthly share prices at Yahoo Finance. XLF also performed a lot better in 2014 than it did during its initial 15 full years of existence based on the monthly medians calculated by using data associated with that historical time frame (Figure 2). The same data set shows the average year’s weakest quarter was the first, with a relatively small positive return, and its strongest quarter was the fourth, with an absolutely large positive return. Clearly, this means there is no historical statistical tendency for the ETF to explode in Q1. Figure 3: XLF’s Top 10 Holdings and P/E-G Ratios, Jan. 9 (click to enlarge) Notes: 1. “NA” means “Not Available.” 2. The XLF holding-weight-by-percentage scale is on the left (green), and the company price/earnings-to-growth ratio scale is on the right (red). Source: This J.J.’s Risky Business chart is based on data at the XLF microsite and FinViz.com (both current as of Jan. 9). Three massive equity-market bubbles are associated with the 21st century. The technology sector was ground zero when the first one burst, and the financial sector was ground zero when the second one burst. In the former case, the Technology Select Sector SPDR ETF ( XLK ) had double-digit percentage losses in each of three consecutive years (2000-2002). In the latter case, XLF had double-digit percentage losses in each of two straight years (2007-2008). It plunged by more than one-half in 2008 alone, which means the ETF is distinguished by delivering the worst annual performance by any of the sector SPDRs since their launch in December 1998. With the third massive stock-market bubble associated with the 21st century apparently in the early stage of its own bursting, I anticipate XLF will continue to be a middle-of-the-pack performer among the sector SPDRs, with the biggest risk to this expectation in the short term being the Federal Open Market Committee announcement April 29. On the one hand, the valuations of XLF’s top 10 holdings appear unlikely to function as tailwinds for the ETF’s price appreciation in the foreseeable future (Figure 3). On the other hand, numbers on the S&P 500 financial sector reported by S&P Senior Index Analyst Howard Silverblatt Dec. 31 suggested it is not all that overvalued, with its P/E-G ratio at 1.31. Disclaimer: The opinions expressed herein by the author do not constitute an investment recommendation, and they are unsuitable for employment in the making of investment decisions. The opinions expressed herein address only certain aspects of potential investment in any securities and cannot substitute for comprehensive investment analysis. The opinions expressed herein are based on an incomplete set of information, illustrative in nature, and limited in scope. In addition, the opinions expressed herein reflect the author’s best judgment as of the date of publication, and they are subject to change without notice. Scalper1 News
Scalper1 News